Regions Bank 2008 Annual Report Download - page 147
Download and view the complete annual report
Please find page 147 of the 2008 Regions Bank annual report below. You can navigate through the pages in the report by either clicking on the pages listed below, or by using the keyword search tool below to find specific information within the annual report.-
 1
1 -
2
-
3
-
4
-
5
-
6
-
7
-
8
-
9
-
10
-
11
-
12
-
13
-
14
-
15
-
16
-
17
-
18
-
19
-
20
-
21
-
22
-
23
-
24
-
25
-
26
-
27
-
28
-
29
-
30
-
31
-
32
-
33
-
34
-
35
-
36
-
37
-
38
-
39
-
40
-
41
-
42
-
43
-
44
-
45
-
46
-
47
-
48
-
49
-
50
-
51
-
52
-
53
-
54
-
55
-
56
-
57
-
58
-
59
-
60
-
61
-
62
-
63
-
64
-
65
-
66
-
67
-
68
-
69
-
70
-
71
-
72
-
73
-
74
-
75
-
76
-
77
-
78
-
79
-
80
-
81
-
82
-
83
-
84
-
85
-
86
-
87
-
88
-
89
-
90
-
91
-
92
-
93
-
94
-
95
-
96
-
97
-
98
-
99
-
100
-
101
-
102
-
103
-
104
-
105
-
106
-
107
-
108
-
109
-
110
-
111
-
112
-
113
-
114
-
115
-
116
-
117
-
118
-
119
-
120
-
121
-
122
-
123
-
124
-
125
-
126
-
127
-
128
-
129
-
130
-
131
-
132
-
133
-
134
-
135
-
136
-
 137
137 -
 138
138 -
 139
139 -
 140
140 -
 141
141 -
 142
142 -
 143
143 -
 144
144 -
 145
145 -
 146
146 -
 147
147 -
 148
148 -
 149
149 -
 150
150 -
 151
151 -
 152
152 -
 153
153 -
 154
154 -
 155
155 -
 156
156 -
 157
157 -
158
-
159
-
160
-
161
-
162
-
163
-
164
-
165
-
166
-
167
-
168
-
169
-
170
-
171
-
172
-
173
-
174
-
175
-
176
-
177
-
178
-
179
-
180
-
181
-
182
-
183
-
184
 |
 |

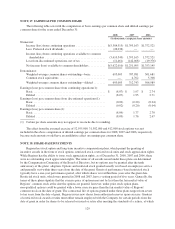
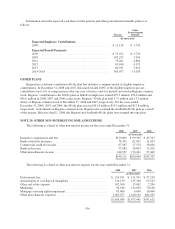
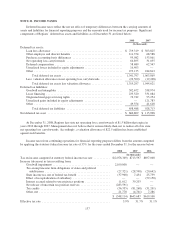
NOTE 21. INCOME TAXES
Deferred income taxes reflect the net tax effect of temporary differences between the carrying amounts of
assets and liabilities for financial reporting purposes and the amounts used for income tax purposes. Significant
components of Regions’ deferred tax assets and liabilities as of December 31 are listed below:
2008 2007
(In thousands)
Deferred tax assets:
Loan loss allowance ................................................ $ 719,319 $ 503,825
Other employee and director benefits ................................... 111,374 68,588
Purchase accounting basis differences .................................. 95,982 153,061
Net operating loss carryforwards ...................................... 66,895 31,035
Deferred compensation .............................................. 58,689 62,547
Unrealized losses included in equity adjustments .......................... 16,403 —
Other ............................................................ 273,135 244,813
Total deferred tax assets ......................................... 1,341,797 1,063,869
Less: valuation allowance on net operating loss carryforwards ............... (22,500) (19,248)
Total deferred tax assets less valuation allowance ..................... 1,319,297 1,044,621
Deferred tax liabilities:
Goodwill and intangibles ............................................ 302,672 338,974
Lease financing .................................................... 233,520 331,084
Originated mortgage servicing rights ................................... 72,742 95,254
Unrealized gains included in equity adjustments .......................... — 121,783
Other ............................................................ 49,554 41,618
Total deferred tax liabilities ...................................... 658,488 928,713
Net deferred tax asset ................................................... $ 660,809 $ 115,908
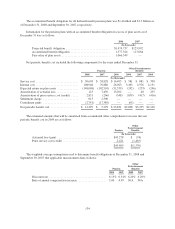
At December 31, 2008, Regions has state net operating loss carryforwards of $1.5 billion that expire in
years 2010 through 2027. Management does not believe that it is more-likely-than-not to realize all of its state
net operating loss carryforwards. Accordingly, a valuation allowance of $22.5 million has been established
against such benefits.
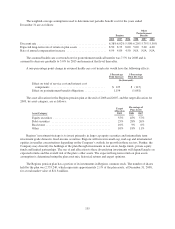
Income taxes from continuing operations for financial reporting purposes differs from the amount computed
by applying the statutory federal income tax rate of 35% for the years ended December 31, for the reasons below:
2008 2007 2006
(In thousands)
Tax on income computed at statutory federal income tax rate ........... $(2,076,349) $713,597 $697,068
Increase (decrease) in taxes resulting from:
Goodwill impairment ....................................... 2,100,000 — —
Tax-exempt income from obligations of states and political
subdivisions ............................................ (27,321) (28,598) (20,642)
State income tax, net of federal tax benefit ...................... (37,908) 7,454 25,739
Effect of recapitalization of subsidiary ......................... — — (59,150)
Interest accrued related to uncertain tax positions ................. 11,612 39,203 —
Net release of uncertain tax position reserves .................... (283,591) — —
Tax credits ............................................... (56,335) (81,268) (31,201)
Other, net ................................................ 21,778 (4,701) 7,286
$ (348,114) $645,687 $619,100
Effective tax rate .............................................. 5.9% 31.7% 31.1%
137