Regions Bank 2008 Annual Report Download - page 55
Download and view the complete annual report
Please find page 55 of the 2008 Regions Bank annual report below. You can navigate through the pages in the report by either clicking on the pages listed below, or by using the keyword search tool below to find specific information within the annual report.-
 1
1 -
2
-
3
-
4
-
5
-
6
-
7
-
8
-
9
-
10
-
11
-
12
-
13
-
14
-
15
-
16
-
17
-
18
-
19
-
20
-
21
-
22
-
23
-
24
-
25
-
26
-
27
-
28
-
29
-
30
-
31
-
32
-
33
-
34
-
35
-
36
-
37
-
38
-
39
-
40
-
41
-
42
-
43
-
44
-
 45
45 -
 46
46 -
 47
47 -
 48
48 -
 49
49 -
 50
50 -
 51
51 -
 52
52 -
 53
53 -
 54
54 -
 55
55 -
 56
56 -
 57
57 -
 58
58 -
 59
59 -
 60
60 -
 61
61 -
 62
62 -
 63
63 -
 64
64 -
 65
65 -
66
-
67
-
68
-
69
-
70
-
71
-
72
-
73
-
74
-
75
-
76
-
77
-
78
-
79
-
80
-
81
-
82
-
83
-
84
-
85
-
86
-
87
-
88
-
89
-
90
-
91
-
92
-
93
-
94
-
95
-
96
-
97
-
98
-
99
-
100
-
101
-
102
-
103
-
104
-
105
-
106
-
107
-
108
-
109
-
110
-
111
-
112
-
113
-
114
-
115
-
116
-
117
-
118
-
119
-
120
-
121
-
122
-
123
-
124
-
125
-
126
-
127
-
128
-
129
-
130
-
131
-
132
-
133
-
134
-
135
-
136
-
137
-
138
-
139
-
140
-
141
-
142
-
143
-
144
-
145
-
146
-
147
-
148
-
149
-
150
-
151
-
152
-
153
-
154
-
155
-
156
-
157
-
158
-
159
-
160
-
161
-
162
-
163
-
164
-
165
-
166
-
167
-
168
-
169
-
170
-
171
-
172
-
173
-
174
-
175
-
176
-
177
-
178
-
179
-
180
-
181
-
182
-
183
-
184
 |
 |
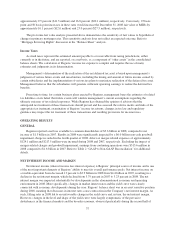
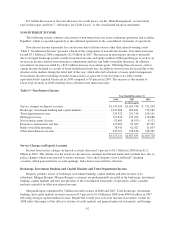
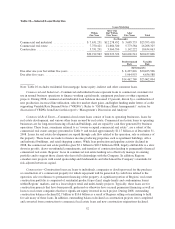
During 2008, the Company sold mortgage servicing rights on approximately $3.4 billion of GNMA loans
and recognized a loss of $14.9 million, including transaction costs. At December 31, 2008, Regions’ servicing
portfolio totaled $36.6 billion and included 306,153 loans. Of this portfolio, $21.2 billion were serviced for third
parties. At December 31, 2007, the servicing portfolio totaled $43.1 billion, $26.9 billion of which were serviced
for third parties. Regions’ mortgage division, primarily through retail operations in its 16-state footprint,
originated mortgage loans totaling $5.4 billion in 2008 compared to $6.9 billion in 2007. The decrease is
primarily related to lower demand and general stresses in the housing sector.
During the first quarter of 2007, Regions sold its non-conforming mortgage origination subsidiary,
EquiFirst, for an original sales price of approximately $76 million and recorded an after-tax gain of
approximately $1 million at the time of sale. The sales price was subject to adjustment and was finalized during
2008 resulting in approximately $10 million of additional after-tax expense to Regions. See Note 4
“Discontinued Operations” to the consolidated financial statements for further detail. During the third quarter of
2007, Regions also exited the wholesale warehouse lending business as a result of risk and return considerations.
In addition, Regions sold approximately $1.9 billion of its $4.5 billion out-of-market mortgage servicing
portfolio in 2007, realizing a loss on the sale of approximately $4.4 million.
Net Securities Gains (Losses)
Regions reported net gains of $92.5 million from the sale of securities available for sale in 2008, as
compared to net losses of $8.6 million in 2007. The 2008 net gains were primarily related to the sale of federal
agency debentures and U.S. treasury securities in the first quarter of 2008.
Insurance Commissions and Fees
Insurance commissions and fees increased 11 percent to $110.1 million in 2008, compared to $99.4 million
in 2007. This increase is primarily due to increased revenues from the mid-2007 acquisition of Miles & Finch
and the acquisition of Barksdale Bonding and Insurance, Inc, which closed in early 2008. A general increase in
commissions related to new business production and higher premiums were also a contributing factor in the year-
over-year increase.
Bank-Owned Life Insurance
Bank-owned life insurance income increased 26 percent to $78.3 million in 2008, compared to $62.0 million
in 2007. This increase is primarily due to additional purchases of bank-owned life insurance policies totaling
$967 million in late 2007 and early 2008.
Other Miscellaneous Income
Other miscellaneous income decreased $12.9 million, or 5 percent, from $258.6 million in 2007 to $245.7
million in 2008. A significant driver of the decrease is due to a $26.2 million decrease in gains on the sale of
loans in 2008 and a $21.3 million increase in losses related to write-downs of low income housing investments.
In addition in 2007, Regions recognized a $9.1 million gain on the termination of Union Planters hybrid debt and
a $13.3 million gain on disposal of residual interests in an acquired subsidiary. Also, in 2007, Regions recognized
a $7.3 million gain related to a sale of certain mutual funds. Offsetting these events was a $62.8 million gain on
the redemption of Visa shares in 2008.
45