Regions Bank 2008 Annual Report Download - page 89
Download and view the complete annual report
Please find page 89 of the 2008 Regions Bank annual report below. You can navigate through the pages in the report by either clicking on the pages listed below, or by using the keyword search tool below to find specific information within the annual report.-
 1
1 -
2
-
3
-
4
-
5
-
6
-
7
-
8
-
9
-
10
-
11
-
12
-
13
-
14
-
15
-
16
-
17
-
18
-
19
-
20
-
21
-
22
-
23
-
24
-
25
-
26
-
27
-
28
-
29
-
30
-
31
-
32
-
33
-
34
-
35
-
36
-
37
-
38
-
39
-
40
-
41
-
42
-
43
-
44
-
45
-
46
-
47
-
48
-
49
-
50
-
51
-
52
-
53
-
54
-
55
-
56
-
57
-
58
-
59
-
60
-
61
-
62
-
63
-
64
-
65
-
66
-
67
-
68
-
69
-
70
-
71
-
72
-
73
-
74
-
75
-
76
-
77
-
78
-
 79
79 -
 80
80 -
 81
81 -
 82
82 -
 83
83 -
 84
84 -
 85
85 -
 86
86 -
 87
87 -
 88
88 -
 89
89 -
 90
90 -
 91
91 -
 92
92 -
 93
93 -
 94
94 -
 95
95 -
 96
96 -
 97
97 -
 98
98 -
 99
99 -
100
-
101
-
102
-
103
-
104
-
105
-
106
-
107
-
108
-
109
-
110
-
111
-
112
-
113
-
114
-
115
-
116
-
117
-
118
-
119
-
120
-
121
-
122
-
123
-
124
-
125
-
126
-
127
-
128
-
129
-
130
-
131
-
132
-
133
-
134
-
135
-
136
-
137
-
138
-
139
-
140
-
141
-
142
-
143
-
144
-
145
-
146
-
147
-
148
-
149
-
150
-
151
-
152
-
153
-
154
-
155
-
156
-
157
-
158
-
159
-
160
-
161
-
162
-
163
-
164
-
165
-
166
-
167
-
168
-
169
-
170
-
171
-
172
-
173
-
174
-
175
-
176
-
177
-
178
-
179
-
180
-
181
-
182
-
183
-
184
 |
 |
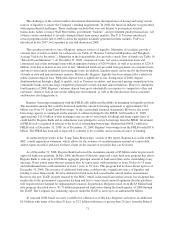
The Company has taken a number of measures to aggressively manage the portfolios and mitigate losses,
particularly in the more problematic portfolios, including the residential homebuilder portfolio, a subset of the
commercial real estate and construction loan portfolios. Significant action in the management of the home equity
portfolio has also been taken. A home equity portfolio evaluation was completed during 2008, which provided
detailed property level information to assist in workout strategies. Also, the Company has a strong Customer
Assistance Program in place, designed to educate customers about their loans and, as necessary, discuss options
and solutions.
As a result of the unfavorable trends in credit quality previously described, including the expectation of a
challenging economy and rising non-performing asset levels driven largely by deterioration in the Company’s
residential homebuilder and condominium portfolios, management expects that net loan charge-offs will continue
at an elevated level during the year ended December 31, 2009.
Reflecting the difficult credit environment as described above, the provision for loan losses rose
significantly during 2008, totaling $2.1 billion, as compared to $555.0 million in the previous year.
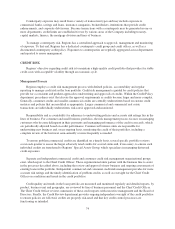
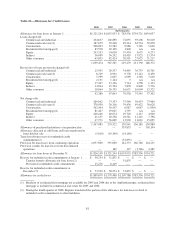
Details regarding the allowance for credit losses, including an analysis of activity from the previous year’s
total, are included in Table 22 “Allowance for Credit Losses.” Management expects the allowance for credit
losses to total loans ratio to vary over time due to changes in economic conditions, loan mix and collateral
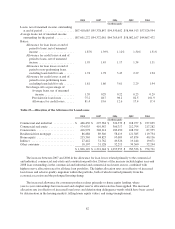
values, or variations in other factors that may affect inherent losses. Also, refer to Table 23 “Allocation of the
Allowance for Loan Losses” for details pertaining to management’s allocation of the allowance for loan losses to
each loan category.
Allowance Process
Factors considered by management in determining the adequacy of the allowance include, but are not
limited to: (1) detailed reviews of individual loans; (2) historical and current trends in gross and net loan charge-
offs for the various portfolio segments evaluated; (3) the Company’s policies relating to delinquent loans and
charge-offs; (4) the level of the allowance in relation to total loans and to historical loss levels; (5) levels and
trends in non-performing and past due loans; (6) collateral values of properties securing loans; (7) the
composition of the loan portfolio, including unfunded credit commitments; and (8) management’s analysis of
current economic conditions.
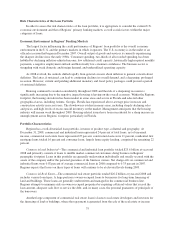
Various departments, including Credit Review, Commercial and Consumer Credit Risk Management,
Collections, and Special Assets are involved in the credit risk management process to assess the accuracy of risk
ratings, the quality of the portfolio and the estimation of inherent credit losses in the loan portfolio. This
comprehensive process also assists in the prompt identification of problem credits.
For the majority of the loan portfolio, management uses information from its ongoing review processes to
stratify the loan portfolio into pools sharing common risk characteristics. Loans that share common risk
characteristics are assigned a portion of the allowance for credit losses based on the assessment process described
above. Credit exposures are categorized by type and assigned estimated amounts of inherent loss based on
several factors, including current and historical loss experience for each pool and management’s judgment of
current economic conditions and their expected impact on credit performance.
Loans deemed to be impaired include non-accrual loans, excluding consumer loans, and TDRs. Impaired
loans, excluding consumer loans, with outstanding balances greater than $2.5 million are evaluated individually.
For these loans, Regions measures the level of impairment based on the present value of the estimated projected
cash flows, the estimated value of the collateral or, if available, the observable market price. For consumer
TDRs, Regions measures the level of impairment based on pools of loans stratified by common risk
characteristics. If current valuations are lower than the current book balance of the credit, the negative
differences are reviewed for possible charge-off. In instances where management determines that a charge-off is
79