Regions Bank 2008 Annual Report Download - page 78
Download and view the complete annual report
Please find page 78 of the 2008 Regions Bank annual report below. You can navigate through the pages in the report by either clicking on the pages listed below, or by using the keyword search tool below to find specific information within the annual report.-
 1
1 -
2
-
3
-
4
-
5
-
6
-
7
-
8
-
9
-
10
-
11
-
12
-
13
-
14
-
15
-
16
-
17
-
18
-
19
-
20
-
21
-
22
-
23
-
24
-
25
-
26
-
27
-
28
-
29
-
30
-
31
-
32
-
33
-
34
-
35
-
36
-
37
-
38
-
39
-
40
-
41
-
42
-
43
-
44
-
45
-
46
-
47
-
48
-
49
-
50
-
51
-
52
-
53
-
54
-
55
-
56
-
57
-
58
-
59
-
60
-
61
-
62
-
63
-
64
-
65
-
66
-
67
-
 68
68 -
 69
69 -
 70
70 -
 71
71 -
 72
72 -
 73
73 -
 74
74 -
 75
75 -
 76
76 -
 77
77 -
 78
78 -
 79
79 -
 80
80 -
 81
81 -
 82
82 -
 83
83 -
 84
84 -
 85
85 -
 86
86 -
 87
87 -
 88
88 -
89
-
90
-
91
-
92
-
93
-
94
-
95
-
96
-
97
-
98
-
99
-
100
-
101
-
102
-
103
-
104
-
105
-
106
-
107
-
108
-
109
-
110
-
111
-
112
-
113
-
114
-
115
-
116
-
117
-
118
-
119
-
120
-
121
-
122
-
123
-
124
-
125
-
126
-
127
-
128
-
129
-
130
-
131
-
132
-
133
-
134
-
135
-
136
-
137
-
138
-
139
-
140
-
141
-
142
-
143
-
144
-
145
-
146
-
147
-
148
-
149
-
150
-
151
-
152
-
153
-
154
-
155
-
156
-
157
-
158
-
159
-
160
-
161
-
162
-
163
-
164
-
165
-
166
-
167
-
168
-
169
-
170
-
171
-
172
-
173
-
174
-
175
-
176
-
177
-
178
-
179
-
180
-
181
-
182
-
183
-
184
 |
 |

about the direction and volatility of interest rates, the slope of the yield curve, and the changing composition of
the balance sheet that result from both strategic plans and from customer behavior. Among the assumptions are
expectations of balance sheet growth and composition, the pricing and maturity characteristics of existing
business and the characteristics of future business. Interest rate-related risks are expressly considered, such as
pricing spreads, the lag time in pricing administered rate accounts, prepayments and other option risks. Regions
considers these factors, as well as the degree of certainty or uncertainty surrounding their future behavior.
Financial derivative instruments are used in hedging the values of selected assets and liabilities against changes
in interest rates. The effect of these hedges is included in the simulations of net interest income.
The primary objective of Asset/Liability Management at Regions is to coordinate balance sheet composition
with interest rate risk management to sustain reasonable and stable net interest income throughout various
interest rate cycles. A standard set of alternate interest rate scenarios is compared to the results of the base case
scenario to determine the extent of potential fluctuations and to establish exposure limits. The standard set of
interest rate scenarios includes the traditional instantaneous parallel rate shifts of plus and minus 100 and 200
basis points. However, for the purposes of analyzing the impact of further downward movement in the rate
structure, in the down scenarios, whenever prevailing rates are less than 100 basis points (e.g. the Federal Funds
Target rate is currently at 0 to 25 basis points) rates have been assumed to be zero. Accordingly, the Company
has determined that the down 200 scenario that is typically calculated is not a meaningful measure. Refer to
Table 20 “Interest Rate Sensitivity” for more information.
In addition to instantaneous scenarios, Regions employs simulations of gradual interest rate movements that
may more realistically mimic potential interest rate movements. The gradual scenarios include curve steepening,
flattening and parallel movements of various magnitudes phased in over a six-month period.
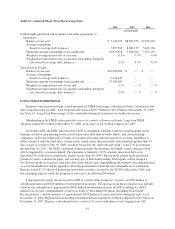
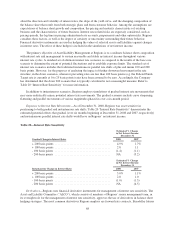
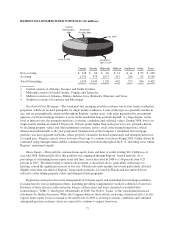
Exposure to Interest Rate Movements—As of December 31, 2008, Regions was asset sensitive in
positioning to both gradual and instantaneous rate shifts. Table 20 “Interest Rate Sensitivity” demonstrates the
estimated potential effects that gradual (over six months beginning at December 31, 2008 and 2007, respectively)
and instantaneous parallel interest rate shifts would have on Regions’ net interest income.
Table 20—Interest Rate Sensitivity
Estimated % Change
in Net Interest Income
December 31
Gradual Change in Interest Rates 2008 2007
+ 200 basis points ...................................... 4.9% 1.7%
+ 100 basis points ...................................... 2.8 1.1
- 100 basis points ...................................... (1.4) (1.1)
- 200 basis points ...................................... NA (3.2)
Estimated % Change
in Net Interest Income
December 31
Instantaneous Change in Interest Rates 2008 2007
+ 200 basis points ...................................... 5.0% 1.1%
+ 100 basis points ...................................... 2.8 1.0
- 100 basis points ...................................... (1.0) (1.5)
- 200 basis points ...................................... NA (4.5)
Derivatives—Regions uses financial derivative instruments for management of interest rate sensitivity. The
Asset and Liability Committee (“ALCO”), which consists of members of Regions’ senior management team, in
its oversight role for the management of interest rate sensitivity, approves the use of derivatives in balance sheet
hedging strategies. The most common derivatives Regions employs are forward rate contracts, Eurodollar futures
68