Regions Bank 2008 Annual Report Download - page 96
Download and view the complete annual report
Please find page 96 of the 2008 Regions Bank annual report below. You can navigate through the pages in the report by either clicking on the pages listed below, or by using the keyword search tool below to find specific information within the annual report.-
 1
1 -
2
-
3
-
4
-
5
-
6
-
7
-
8
-
9
-
10
-
11
-
12
-
13
-
14
-
15
-
16
-
17
-
18
-
19
-
20
-
21
-
22
-
23
-
24
-
25
-
26
-
27
-
28
-
29
-
30
-
31
-
32
-
33
-
34
-
35
-
36
-
37
-
38
-
39
-
40
-
41
-
42
-
43
-
44
-
45
-
46
-
47
-
48
-
49
-
50
-
51
-
52
-
53
-
54
-
55
-
56
-
57
-
58
-
59
-
60
-
61
-
62
-
63
-
64
-
65
-
66
-
67
-
68
-
69
-
70
-
71
-
72
-
73
-
74
-
75
-
76
-
77
-
78
-
79
-
80
-
81
-
82
-
83
-
84
-
85
-
 86
86 -
 87
87 -
 88
88 -
 89
89 -
 90
90 -
 91
91 -
 92
92 -
 93
93 -
 94
94 -
 95
95 -
 96
96 -
 97
97 -
 98
98 -
 99
99 -
 100
100 -
 101
101 -
 102
102 -
 103
103 -
 104
104 -
 105
105 -
 106
106 -
107
-
108
-
109
-
110
-
111
-
112
-
113
-
114
-
115
-
116
-
117
-
118
-
119
-
120
-
121
-
122
-
123
-
124
-
125
-
126
-
127
-
128
-
129
-
130
-
131
-
132
-
133
-
134
-
135
-
136
-
137
-
138
-
139
-
140
-
141
-
142
-
143
-
144
-
145
-
146
-
147
-
148
-
149
-
150
-
151
-
152
-
153
-
154
-
155
-
156
-
157
-
158
-
159
-
160
-
161
-
162
-
163
-
164
-
165
-
166
-
167
-
168
-
169
-
170
-
171
-
172
-
173
-
174
-
175
-
176
-
177
-
178
-
179
-
180
-
181
-
182
-
183
-
184
 |
 |
Regions’ common stock is listed on the New York Stock Exchange (“NYSE”) and, therefore, Regions is
required to comply with NYSE corporate governance listing standards. During 2008, Regions submitted to the
NYSE the CEO certification required under Section 303A of the NYSE corporate governance listing standards.
In addition, the CEO and CFO certifications that are required under Section 302 of the Sarbanes-Oxley Act of
2002 are filed as Exhibits 31.1 and 31.2, respectively.
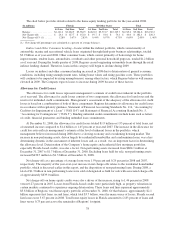
COMPARISON OF 2007 WITH 2006
Earnings in 2007 were affected by integration and merger-related charges related to the acquisition of
AmSouth, which closed on November 4, 2006. Comparisons of 2007 to 2006 are therefore significantly impacted
by the merger. Primary drivers of 2007 earnings, other than a full-year impact of the AmSouth merger, were
Regions’ solid fee income, record performance at Morgan Keegan and overall expense control. However, certain
valuation-related and other charges during the fourth quarter of 2007, as well as a higher provision for loan losses
resulting from rapid deterioration of credit quality, contributed to lower earnings per share for 2007.
Net income from continuing operations in 2007 was $1.4 billion, or $1.95 per diluted share, representing a
28 percent decrease from 2006 diluted earnings per share of $2.71. Not included in this amount, Regions incurred
a $217.4 million pre-tax loss related to EquiFirst resulting in an after-tax net loss for the year of $142.1 million,
which was accounted for as discontinued operations. Net income in 2007 includes after-tax merger charges of
$217.5 million, or $0.31 per diluted share, compared to 2006 after-tax merger charges of $60.3 million, or $0.12
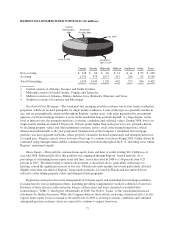
per diluted share. Return on average stockholders’ equity was 6.24 percent for 2007 as compared to 10.94
percent for 2006, while return on average assets was 0.90 percent for 2007, down from the 2006 level of 1.41
percent. Return on average tangible stockholders’ equity was 15.82 percent for the year ended December 31,
2007, compared to 22.86 percent for the year ended December 31, 2006 (20.43 percent and 24.85 percent,
respectively, excluding discontinued operations and merger charges). See Table 2 “GAAP to Non-GAAP
Reconciliation” for additional details and Table 1 “Financial Highlights” for additional ratios.
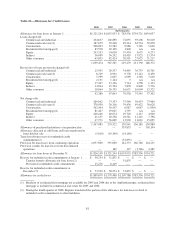
Net interest income was $4.4 billion in 2007 compared to $3.3 billion in 2006. The increase was driven by a
larger balance sheet for the full year, resulting from the merger with AmSouth in late 2006. However, negatively
impacting net interest income was a lower net interest margin, which declined to 3.79 percent during 2007
compared to 4.17 percent in 2006. Primary drivers of the reduced net interest margin include the impact of
integrating AmSouth’s balance sheet into Regions, a decline in low-cost deposit balances, and the negative
effects of a lower tax-equivalent adjustment resulting from the first quarter 2007 adoption of Financial
Accounting Standards Board Interpretation No. 48, “Accounting for Uncertainty in Income Taxes” (“FIN 48”).
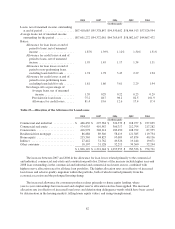
The following discussion of non-interest income and expense is from continuing operations and excludes
EquiFirst, which is reported separately as discontinued operations in the consolidated statements of operations.
Non-interest income (excluding securities gains/losses) totaled $2.9 billion, or 39 percent of total revenue (on a
fully taxable-equivalent basis) in 2007, compared to $2.0 billion, or 37 percent of total revenue (on a fully
taxable-equivalent basis) in 2006, and continued to reflect Regions’ diversified revenue stream. Non-interest
income increased due to the full-year inclusion of AmSouth’s operations.
Service charges on deposit accounts increased 61 percent to $1.2 billion, due primarily to an increase in the
number of total deposit accounts and the addition of new accounts in connection with the AmSouth merger. In
addition to the increased number of accounts related to the merger, 2007 results were affected by the
implementation of a tiered non-sufficient funds (“NSF”) pricing structure, as well as volume-related increases in
NSF fees and interchange income.
Brokerage, investment banking and capital markets income, and trust department income increased in 2007
to $894.6 million and $251.3 million, respectively, compared to $717.0 million and $158.2 million, respectively
in 2006. Part of this increase is attributable to the AmSouth merger, as 2006 only included approximately two
months of combined results compared to a full year for 2007. Merger benefits were realized mainly through an
expanded customer base, primarily through additional Morgan Keegan offices opened in the former AmSouth
86