Regions Bank 2008 Annual Report Download - page 126
Download and view the complete annual report
Please find page 126 of the 2008 Regions Bank annual report below. You can navigate through the pages in the report by either clicking on the pages listed below, or by using the keyword search tool below to find specific information within the annual report.-
 1
1 -
2
-
3
-
4
-
5
-
6
-
7
-
8
-
9
-
10
-
11
-
12
-
13
-
14
-
15
-
16
-
17
-
18
-
19
-
20
-
21
-
22
-
23
-
24
-
25
-
26
-
27
-
28
-
29
-
30
-
31
-
32
-
33
-
34
-
35
-
36
-
37
-
38
-
39
-
40
-
41
-
42
-
43
-
44
-
45
-
46
-
47
-
48
-
49
-
50
-
51
-
52
-
53
-
54
-
55
-
56
-
57
-
58
-
59
-
60
-
61
-
62
-
63
-
64
-
65
-
66
-
67
-
68
-
69
-
70
-
71
-
72
-
73
-
74
-
75
-
76
-
77
-
78
-
79
-
80
-
81
-
82
-
83
-
84
-
85
-
86
-
87
-
88
-
89
-
90
-
91
-
92
-
93
-
94
-
95
-
96
-
97
-
98
-
99
-
100
-
101
-
102
-
103
-
104
-
105
-
106
-
107
-
108
-
109
-
110
-
111
-
112
-
113
-
114
-
115
-
 116
116 -
 117
117 -
 118
118 -
 119
119 -
 120
120 -
 121
121 -
 122
122 -
 123
123 -
 124
124 -
 125
125 -
 126
126 -
 127
127 -
 128
128 -
 129
129 -
 130
130 -
 131
131 -
 132
132 -
 133
133 -
 134
134 -
 135
135 -
 136
136 -
137
-
138
-
139
-
140
-
141
-
142
-
143
-
144
-
145
-
146
-
147
-
148
-
149
-
150
-
151
-
152
-
153
-
154
-
155
-
156
-
157
-
158
-
159
-
160
-
161
-
162
-
163
-
164
-
165
-
166
-
167
-
168
-
169
-
170
-
171
-
172
-
173
-
174
-
175
-
176
-
177
-
178
-
179
-
180
-
181
-
182
-
183
-
184
 |
 |

December 31, 2008 and 2007, respectively. The allowance allocated to TDRs totaled $9.3 million and zero at
December 31, 2008 and 2007, respectively. The average amount of impaired loans was $1,262.2 million during
2008, $396.0 million during 2007 and $212.3 million during 2006. No material amount of interest income was
recognized on impaired loans for the years ended December 31, 2008, 2007 or 2006.
In addition to the impaired loans discussed in the preceding paragraph, there were approximately $423.3
million in nonperforming loans classified as held for sale at December 31, 2008. There were none at
December 31, 2007. The loans are larger balance credits, primarily commercial real estate. Management does not
have the intent to hold these loans for the foreseeable future. The loans are carried at an amount approximating a
price which will be recoverable through the loan sale market. Because the adjusted carrying value is lower than
the outstanding principal, these loans are considered impaired under FAS 114.
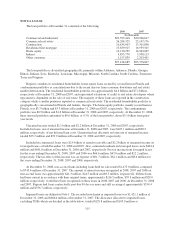
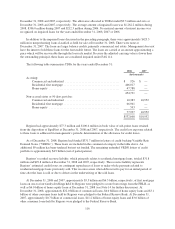
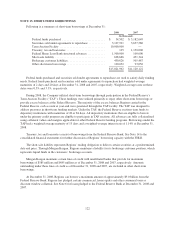
The following table summarizes TDRs for the years ended December 31:
2008 2007
(In thousands)
Accruing:
Commercial and industrial ..................................... $ 926 $ —
Residential first mortgage ...................................... 406,017 —
Home equity ................................................ 47,788 —
454,731 —
Non-accrual status or 90 days past due:
Commercial and industrial ..................................... 10,383 10,952
Residential first mortgage ...................................... 66,961 —
Home equity ................................................ 593 —
77,937 10,952
$532,668 $10,952
Regions had approximately $77.3 million and $100.6 million in book value of sub-prime loans retained
from the disposition of EquiFirst at December 31, 2008 and 2007, respectively. The credit loss exposure related
to these loans is addressed in management’s periodic determination of the allowance for credit losses.
As of December 31, 2008, Regions had funded $331.7 million in letters of credit backing Variable-Rate
Demand Notes (“VRDNs”). These loans are included in the commercial category in the table above. An
additional $9 million has been tendered but not yet funded. The remaining unfunded VRDN letters of credit
portfolio is approximately $4.9 billion (net of participations).
Regions’ recorded recourse liability, which primarily relates to residential mortgage loans, totaled $31.8
million and $29.8 million at December 31, 2008 and 2007, respectively. The recourse liability represents
Regions’ estimated credit losses on contingent repurchases of loans or make-whole payments related to
residential mortgage loans previously sold. This recourse arises when debtors fail to pay for an initial period of
time after the loan is sold or due to defects in the underwriting of the sold loans.
At December 31, 2008 and 2007, approximately $5.5 billion and $6.3 billion, respectively, of first mortgage
loans on one-to-four family dwellings held by Regions were pledged to secure borrowings from the FHLB, as
well as $6.0 billion of home equity loans at December 31, 2008 (see Note 14 for further discussion). At
December 31, 2008, approximately $22.0 billion of commercial loans, $6.0 billion of home equity loans and $3.1
billion of other consumer loans held by Regions were pledged to the Federal Reserve Bank. At December 31,
2007, approximately $0.7 billion of commercial loans, $11.2 billion of home equity loans and $3.0 billion of
other consumer loans held by Regions were pledged to the Federal Reserve Bank.
116