Regions Bank 2008 Annual Report Download - page 154
Download and view the complete annual report
Please find page 154 of the 2008 Regions Bank annual report below. You can navigate through the pages in the report by either clicking on the pages listed below, or by using the keyword search tool below to find specific information within the annual report.-
 1
1 -
2
-
3
-
4
-
5
-
6
-
7
-
8
-
9
-
10
-
11
-
12
-
13
-
14
-
15
-
16
-
17
-
18
-
19
-
20
-
21
-
22
-
23
-
24
-
25
-
26
-
27
-
28
-
29
-
30
-
31
-
32
-
33
-
34
-
35
-
36
-
37
-
38
-
39
-
40
-
41
-
42
-
43
-
44
-
45
-
46
-
47
-
48
-
49
-
50
-
51
-
52
-
53
-
54
-
55
-
56
-
57
-
58
-
59
-
60
-
61
-
62
-
63
-
64
-
65
-
66
-
67
-
68
-
69
-
70
-
71
-
72
-
73
-
74
-
75
-
76
-
77
-
78
-
79
-
80
-
81
-
82
-
83
-
84
-
85
-
86
-
87
-
88
-
89
-
90
-
91
-
92
-
93
-
94
-
95
-
96
-
97
-
98
-
99
-
100
-
101
-
102
-
103
-
104
-
105
-
106
-
107
-
108
-
109
-
110
-
111
-
112
-
113
-
114
-
115
-
116
-
117
-
118
-
119
-
120
-
121
-
122
-
123
-
124
-
125
-
126
-
127
-
128
-
129
-
130
-
131
-
132
-
133
-
134
-
135
-
136
-
137
-
138
-
139
-
140
-
141
-
142
-
143
-
 144
144 -
 145
145 -
 146
146 -
 147
147 -
 148
148 -
 149
149 -
 150
150 -
 151
151 -
 152
152 -
 153
153 -
 154
154 -
 155
155 -
 156
156 -
 157
157 -
 158
158 -
 159
159 -
 160
160 -
 161
161 -
 162
162 -
 163
163 -
 164
164 -
165
-
166
-
167
-
168
-
169
-
170
-
171
-
172
-
173
-
174
-
175
-
176
-
177
-
178
-
179
-
180
-
181
-
182
-
183
-
184
 |
 |

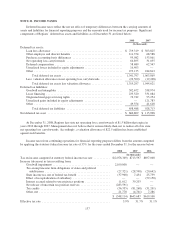
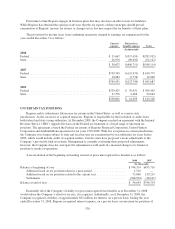
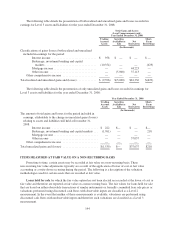
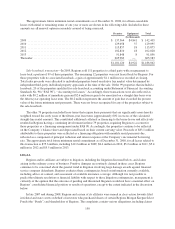
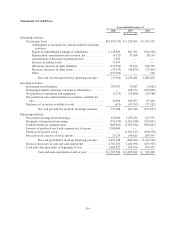
The following table details the presentation of both realized and unrealized gains and losses recorded in
earnings for Level 3 assets and liabilities for the year ended December 31, 2008:
Total Gains and Losses
(Level 3 measurements only)
Year Ended December 31, 2008
Trading
Account
Assets
Securities
Available for
Sale
Net
Derivatives
Short-
Term
Borrowings
(In thousands)
Classifications of gains (losses) both realized and unrealized
included in earnings for the period:
Interest income .............................. $ 958 $ — $ — $—
Brokerage, investment banking and capital
markets ................................... (10,354) — — (429)
Mortgage income ............................. — — 44,223 —
Other income ................................ — (5,000) 37,113 —
Other comprehensive income ....................... — — — —
Total realized and unrealized gains and (losses) ............. $ (9,396) $(5,000) $81,336 $(429)
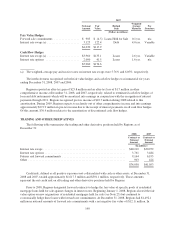
The following table details the presentation of only unrealized gains and losses recorded in earnings for
Level 3 assets and liabilities for the year ended December 31, 2008:
Year Ended December 31, 2008
Trading
Account
Assets
Securities
Available for
Sale
Net
Derivatives
Short-
Term
Borrowings
(In thousands)
The amount of total gains and losses for the period included in
earnings, attributable to the change in unrealized gains (losses)
relating to assets and liabilities still held at December 31,
2008:
Interest income ............................... $ 222 $— $ — $—
Brokerage, investment banking and capital markets . . . (1,761) — — 218
Mortgage income .............................. — — — —
Other income ................................. — — 37,037 —
Other comprehensive income ........................ — — — —
Total unrealized gains and (losses) ........................ $(1,539) $— $37,037 $218
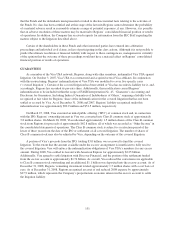
ITEMS MEASURED AT FAIR VALUE ON A NON-RECURRING BASIS
From time to time, certain assets may be recorded at fair value on a non-recurring basis. These
non-recurring fair value adjustments typically are a result of the application of lower of cost or fair value
accounting or a write-down occurring during the period. The following is a description of the valuation
methodologies used for certain assets that are recorded at fair value.
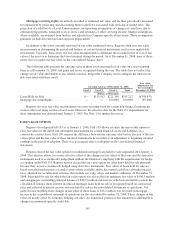
Loans held for sale for which the fair value option has not been elected are recorded at the lower of cost or
fair value and therefore are reported at fair value on a non-recurring basis. The fair values for loans held for sale
that are based on either observable transactions of similar instruments or formally committed loan sale prices or
valuations performed using discounted cash flows with observable inputs are classified as a Level 2
measurement. In the event that neither of these measurements is available, valuations are performed using
discounted cash flows with unobservable inputs and therefore such valuations are classified as a Level 3
measurement.
144