Regions Bank 2008 Annual Report Download - page 50
Download and view the complete annual report
Please find page 50 of the 2008 Regions Bank annual report below. You can navigate through the pages in the report by either clicking on the pages listed below, or by using the keyword search tool below to find specific information within the annual report.-
 1
1 -
2
-
3
-
4
-
5
-
6
-
7
-
8
-
9
-
10
-
11
-
12
-
13
-
14
-
15
-
16
-
17
-
18
-
19
-
20
-
21
-
22
-
23
-
24
-
25
-
26
-
27
-
28
-
29
-
30
-
31
-
32
-
33
-
34
-
35
-
36
-
37
-
38
-
39
-
 40
40 -
 41
41 -
 42
42 -
 43
43 -
 44
44 -
 45
45 -
 46
46 -
 47
47 -
 48
48 -
 49
49 -
 50
50 -
 51
51 -
 52
52 -
 53
53 -
 54
54 -
 55
55 -
 56
56 -
 57
57 -
 58
58 -
 59
59 -
 60
60 -
61
-
62
-
63
-
64
-
65
-
66
-
67
-
68
-
69
-
70
-
71
-
72
-
73
-
74
-
75
-
76
-
77
-
78
-
79
-
80
-
81
-
82
-
83
-
84
-
85
-
86
-
87
-
88
-
89
-
90
-
91
-
92
-
93
-
94
-
95
-
96
-
97
-
98
-
99
-
100
-
101
-
102
-
103
-
104
-
105
-
106
-
107
-
108
-
109
-
110
-
111
-
112
-
113
-
114
-
115
-
116
-
117
-
118
-
119
-
120
-
121
-
122
-
123
-
124
-
125
-
126
-
127
-
128
-
129
-
130
-
131
-
132
-
133
-
134
-
135
-
136
-
137
-
138
-
139
-
140
-
141
-
142
-
143
-
144
-
145
-
146
-
147
-
148
-
149
-
150
-
151
-
152
-
153
-
154
-
155
-
156
-
157
-
158
-
159
-
160
-
161
-
162
-
163
-
164
-
165
-
166
-
167
-
168
-
169
-
170
-
171
-
172
-
173
-
174
-
175
-
176
-
177
-
178
-
179
-
180
-
181
-
182
-
183
-
184
 |
 |

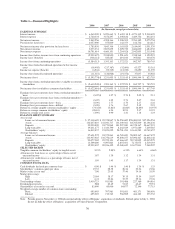
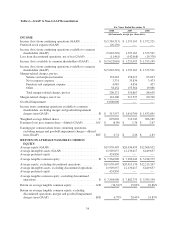
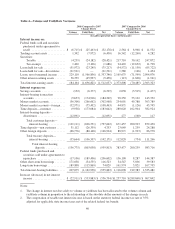
Table 4—Volume and Yield/Rate Variances
2008 Compared to 2007
Change Due to
2007 Compared to 2006
Change Due to
Volume Yield/ Rate Net Volume Yield/ Rate Net
(Taxable-equivalent basis—in thousands)
Interest income on:
Federal funds sold and securities
purchased under agreements to
resell ....................... $ (6,715) $ (25,463) $ (32,178) $ 2,564 $ 8,968 $ 11,532
Trading account assets ............ 1,542 (7,972) (6,430) 16,542 (12,260) 4,282
Securities:
Taxable ................... (4,239) (24,182) (28,421) 217,710 30,162 247,872
Tax-exempt ................ 1,420 (3,106) (1,686) 24,422 (12,632) 11,790
Loans held for sale ............... (51,972) (23,245) (75,217) (54,572) (11,150) (65,722)
Loans held for sale—divestitures . . . (21,521) — (21,521) 1,580 (146) 1,434
Loans, net of unearned income ..... 229,110 (1,566,856) (1,337,746) 2,165,675 (71,599) 2,094,076
Other interest-earning assets ....... 36,539 (45,997) (9,458) (113) (1,828) (1,941)
Total interest-earning assets ....... 184,164 (1,696,821) (1,512,657) 2,373,808 (70,485) 2,303,323
Interest expense on:
Savings accounts ................ (152) (6,377) (6,529) 2,038 (3,515) (1,477)
Interest-bearing transaction
accounts ..................... (9,633) (174,916) (184,549) 90,250 53,102 143,352
Money market accounts ........... (36,306) (266,662) (302,968) 254,001 49,788 303,789
Money market accounts—foreign . . . (32,971) (75,492) (108,463) 44,871 (1,126) 43,745
Time deposits—customer ......... (9,958) (173,084) (183,042) 280,020 102,904 382,924
Interest-bearing deposits—
divestitures ................... (12,091) — (12,091) 277 (160) 117
Total customer deposits—
interest-bearing ........... (101,111) (696,531) (797,642) 671,457 200,993 872,450
Time deposits—non customer ...... 31,112 (26,359) 4,753 23,049 1,239 24,288
Other foreign deposits ............ (66,776) (80,148) (146,924) 88,971 (1,993) 86,978
Total treasury deposits—
interest-bearing ........... (35,664) (106,507) (142,171) 112,020 (754) 111,266
Total interest-bearing
deposits ............. (136,775) (803,038) (939,813) 783,477 200,239 983,716
Federal funds purchased and
securities sold under agreements to
repurchase ................... (17,106) (189,496) (206,602) 136,100 8,287 144,387
Other short-term borrowings ....... 171,058 (54,535) 116,523 34,547 5,036 39,583
Long-term borrowings ............ 189,898 (115,869) 74,029 161,974 5,821 167,795
Total interest-bearing liabilities ..... 207,075 (1,162,938) (955,863) 1,116,098 219,383 1,335,481
Increase (decrease) in net interest
income ...................... $ (22,911) $ (533,883) $ (556,794) $1,257,710 $(289,868) $ 967,842
Notes:
1. The change in interest not due solely to volume or yield/rate has been allocated to the volume column and
yield/rate column in proportion to the relationship of the absolute dollar amounts of the change in each.
2. The computation of taxable net interest income is based on the statutory federal income tax rate of 35%,
adjusted for applicable state income taxes net of the related federal tax benefit.
40