Regions Bank 2008 Annual Report Download - page 153
Download and view the complete annual report
Please find page 153 of the 2008 Regions Bank annual report below. You can navigate through the pages in the report by either clicking on the pages listed below, or by using the keyword search tool below to find specific information within the annual report.-
 1
1 -
2
-
3
-
4
-
5
-
6
-
7
-
8
-
9
-
10
-
11
-
12
-
13
-
14
-
15
-
16
-
17
-
18
-
19
-
20
-
21
-
22
-
23
-
24
-
25
-
26
-
27
-
28
-
29
-
30
-
31
-
32
-
33
-
34
-
35
-
36
-
37
-
38
-
39
-
40
-
41
-
42
-
43
-
44
-
45
-
46
-
47
-
48
-
49
-
50
-
51
-
52
-
53
-
54
-
55
-
56
-
57
-
58
-
59
-
60
-
61
-
62
-
63
-
64
-
65
-
66
-
67
-
68
-
69
-
70
-
71
-
72
-
73
-
74
-
75
-
76
-
77
-
78
-
79
-
80
-
81
-
82
-
83
-
84
-
85
-
86
-
87
-
88
-
89
-
90
-
91
-
92
-
93
-
94
-
95
-
96
-
97
-
98
-
99
-
100
-
101
-
102
-
103
-
104
-
105
-
106
-
107
-
108
-
109
-
110
-
111
-
112
-
113
-
114
-
115
-
116
-
117
-
118
-
119
-
120
-
121
-
122
-
123
-
124
-
125
-
126
-
127
-
128
-
129
-
130
-
131
-
132
-
133
-
134
-
135
-
136
-
137
-
138
-
139
-
140
-
141
-
142
-
 143
143 -
 144
144 -
 145
145 -
 146
146 -
 147
147 -
 148
148 -
 149
149 -
 150
150 -
 151
151 -
 152
152 -
 153
153 -
 154
154 -
 155
155 -
 156
156 -
 157
157 -
 158
158 -
 159
159 -
 160
160 -
 161
161 -
 162
162 -
 163
163 -
164
-
165
-
166
-
167
-
168
-
169
-
170
-
171
-
172
-
173
-
174
-
175
-
176
-
177
-
178
-
179
-
180
-
181
-
182
-
183
-
184
 |
 |

and option pricing models based on market rates and volatilities, or Level 2 measurements. Interest rate lock
commitments on loans intended for sale, treasury locks and credit derivatives are valued using option pricing
models that incorporate significant unobservable inputs, and therefore are Level 3 measurements.
Interest rate swaps are predominantly traded in over-the-counter markets and, as such, values are determined
using widely accepted discounted cash flow models, or Level 2 measurements. These discounted cash flow
models use projections of future cash payments/receipts that are discounted at mid-market rates. These valuations
are adjusted for the unsecured credit risk at the reporting date, which considers collateral posted and the impact
of master netting agreements.
Short-term borrowings recognized at fair value represent short-sale liabilities to counterparties. Short-sale
liabilities are valued based on the fair value of the underlying securities, which are determined in the same
manner as trading account assets and securities available for sale.
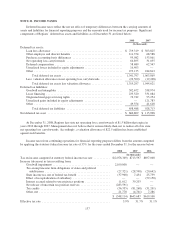
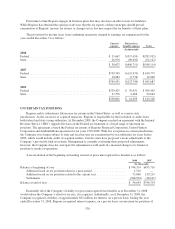
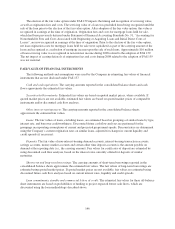
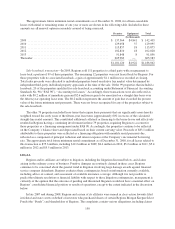
The following table presents financial assets and liabilities measured at fair value on a recurring basis as of
December 31, 2008:
Level 1 Level 2 Level 3 Fair Value
(In thousands)
ASSETS:
Trading account assets ............................ $ 338,133 $ 318,867 $393,270 $ 1,050,270
Securities available for sale ......................... 2,658,994 16,095,449 95,039 18,849,482
Mortgage loans held for sale ........................ — 506,260 — 506,260
Derivative assets (a) .............................. — 1,842,652 54,847 1,897,499
LIABILITIES:
Short-term borrowings ............................ $ 421,799 $ 88,743 $118,124 $ 628,666
Derivative liabilities (a) ........................... — 895,841 — 895,841
(a) Derivative assets and liabilities include approximately $1.6 billion related to legally enforceable master netting
agreements that allow the Company to settle positive and negative positions. Derivative assets and liabilities are
also presented excluding cash collateral received of $108.1 million and cash collateral posted of $450.9 million
with counterparties.
Assets and liabilities in all levels could result in volatile and material price fluctuations. Realized and
unrealized gains and losses on Level 3 assets represent only a portion of the risk to market fluctuations in
Regions’ balance sheets. Further, trading account assets, net derivatives and short-term borrowings included in
Levels 1, 2 and 3 are used by the Asset and Liability Management Committee of the Company in a holistic
approach to managing price fluctuation risks.
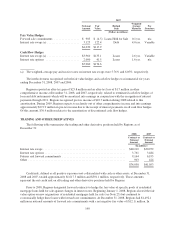
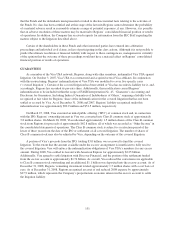
The following table illustrates a rollforward for all assets and (liabilities) measured at fair value on a
recurring basis using significant unobservable inputs (Level 3) for the year ended December 31, 2008:
Fair Value Measurements Using Significant
Unobservable Inputs
Year Ended December 31, 2008
(Level 3 measurements only)
Trading
Account
Assets
Securities
Available
for Sale
Net
Derivatives
Short-Term
Borrowings
(In thousands)
Beginning balance, January 1, 2008 ........................ $ 166,003 $ 73,003 $ 8,122 $ 57,456
Total gains (losses) realized and unrealized:
Included in earnings ............................ (9,396) (5,000) 81,336 (429)
Included in other comprehensive income ............ — (3,428) — —
Purchases and issuances ............................. 3,277,881 49,100 459 (8,450,525)
Settlements ....................................... (3,020,867) (23,716) (35,070) 8,488,904
Transfers in and/or out of Level 3, net .................. (20,351) 5,080 — 22,718
Ending balance, December 31, 2008 ....................... $ 393,270 $ 95,039 $ 54,847 $ 118,124
143