Regions Bank 2008 Annual Report Download - page 91
Download and view the complete annual report
Please find page 91 of the 2008 Regions Bank annual report below. You can navigate through the pages in the report by either clicking on the pages listed below, or by using the keyword search tool below to find specific information within the annual report.-
 1
1 -
2
-
3
-
4
-
5
-
6
-
7
-
8
-
9
-
10
-
11
-
12
-
13
-
14
-
15
-
16
-
17
-
18
-
19
-
20
-
21
-
22
-
23
-
24
-
25
-
26
-
27
-
28
-
29
-
30
-
31
-
32
-
33
-
34
-
35
-
36
-
37
-
38
-
39
-
40
-
41
-
42
-
43
-
44
-
45
-
46
-
47
-
48
-
49
-
50
-
51
-
52
-
53
-
54
-
55
-
56
-
57
-
58
-
59
-
60
-
61
-
62
-
63
-
64
-
65
-
66
-
67
-
68
-
69
-
70
-
71
-
72
-
73
-
74
-
75
-
76
-
77
-
78
-
79
-
80
-
 81
81 -
 82
82 -
 83
83 -
 84
84 -
 85
85 -
 86
86 -
 87
87 -
 88
88 -
 89
89 -
 90
90 -
 91
91 -
 92
92 -
 93
93 -
 94
94 -
 95
95 -
 96
96 -
 97
97 -
 98
98 -
 99
99 -
 100
100 -
 101
101 -
102
-
103
-
104
-
105
-
106
-
107
-
108
-
109
-
110
-
111
-
112
-
113
-
114
-
115
-
116
-
117
-
118
-
119
-
120
-
121
-
122
-
123
-
124
-
125
-
126
-
127
-
128
-
129
-
130
-
131
-
132
-
133
-
134
-
135
-
136
-
137
-
138
-
139
-
140
-
141
-
142
-
143
-
144
-
145
-
146
-
147
-
148
-
149
-
150
-
151
-
152
-
153
-
154
-
155
-
156
-
157
-
158
-
159
-
160
-
161
-
162
-
163
-
164
-
165
-
166
-
167
-
168
-
169
-
170
-
171
-
172
-
173
-
174
-
175
-
176
-
177
-
178
-
179
-
180
-
181
-
182
-
183
-
184
 |
 |

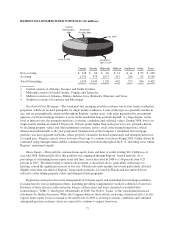
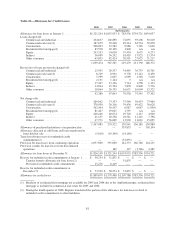
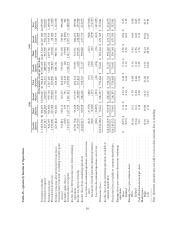
Table 22—Allowance for Credit Losses
2008 2007 2006 2005 2004
(In thousands)
Allowance for loan losses at January 1 ................. $1,321,244 $1,055,953 $ 783,536 $754,721 $454,057
Loans charged-off:
Commercial and industrial ....................... 234,637 102,890 72,035 93,206 92,610
Commercial real estate(1) ....................... 387,679 39,248 49,214 62,534 39,078
Construction .................................. 568,093 32,582 9,986 7,365 5,620
Residential first mortgage(1) ..................... 83,578 20,169 1,800 n/a n/a
Equity ....................................... 243,553 54,010 37,434 3,675 6,273
Indirect ...................................... 56,099 36,242 18,419 17,925 13,574
Other consumer ............................... 65,835 82,424 30,591 27,025 31,217
1,639,474 367,565 219,479 211,730 188,372
Recoveries of loans previously charged-off:
Commercial and industrial ....................... 25,595 29,537 34,495 36,753 18,701
Commercial real estate(1) ....................... 8,749 8,932 9,778 13,112 8,450
Construction .................................. 5,599 2,035 2,999 1,318 7,610
Residential first mortgage(1) ..................... 2,131 1,144 3 n/a n/a
Equity ....................................... 17,307 13,336 7,714 1,558 1,333
Indirect ...................................... 14,944 15,704 7,878 6,800 5,776
Other consumer ............................... 18,064 26,355 16,671 16,004 15,522
92,389 97,043 79,538 75,545 57,392
Net charge-offs:
Commercial and industrial ....................... 209,042 73,353 37,540 56,453 73,909
Commercial real estate(1) ....................... 378,930 30,316 39,436 49,422 30,628
Construction .................................. 562,494 30,547 6,987 6,047 (1,990)
Residential first mortgage(1) ..................... 81,447 19,025 1,797 n/a n/a
Equity ....................................... 226,246 40,674 29,720 2,117 4,940
Indirect ...................................... 41,155 20,538 10,541 11,125 7,798
Other consumer ............................... 47,771 56,069 13,920 11,021 15,695
1,547,085 270,522 139,941 136,185 130,980
Allowance of purchased institutions at acquisition date .... — — 335,833 — 303,144
Allowance allocated to sold loans and loans transferred to
loans held for sale ................................ (5,010) (19,369) (14,140) — —
Transfer to/from reserve for unfunded credit
commitments(2) ................................. — — (51,835) — —
Provision for loan losses from continuing operations ...... 2,057,000 555,000 142,373 166,746 124,215
Provision (credit) for loan losses from discontinued
operations ...................................... — 182 127 (1,746) 4,285
Allowance for loan losses at December 31 .............. $1,826,149 $1,321,244 $1,055,953 $783,536 $754,721
Reserve for unfunded credit commitments at January 1 .... $ 58,254 $ 51,835 $ — $ — $ —
Transfer from/to allowance for loan losses(2) ........ — — 51,835 — —
Provision for unfunded credit commitments ......... 15,276 6,419 — — —
Reserve for unfunded credit commitments at
December 31 ................................... $ 73,530 $ 58,254 $ 51,835 $ — $ —
Allowance for credit losses .......................... $1,899,679 $1,379,498 $1,107,788 $783,536 $754,721
(1) Breakout of residential first mortgage not available for 2005 and 2004 due to the AmSouth merger; residential first
mortgage is included in commercial real estate for 2005 and 2004.
(2) During the fourth quarter of 2006, Regions transferred the portion of the allowance for loan losses related to
unfunded credit commitments to other liabilities.
81