Regions Bank 2008 Annual Report Download - page 162
Download and view the complete annual report
Please find page 162 of the 2008 Regions Bank annual report below. You can navigate through the pages in the report by either clicking on the pages listed below, or by using the keyword search tool below to find specific information within the annual report.-
 1
1 -
2
-
3
-
4
-
5
-
6
-
7
-
8
-
9
-
10
-
11
-
12
-
13
-
14
-
15
-
16
-
17
-
18
-
19
-
20
-
21
-
22
-
23
-
24
-
25
-
26
-
27
-
28
-
29
-
30
-
31
-
32
-
33
-
34
-
35
-
36
-
37
-
38
-
39
-
40
-
41
-
42
-
43
-
44
-
45
-
46
-
47
-
48
-
49
-
50
-
51
-
52
-
53
-
54
-
55
-
56
-
57
-
58
-
59
-
60
-
61
-
62
-
63
-
64
-
65
-
66
-
67
-
68
-
69
-
70
-
71
-
72
-
73
-
74
-
75
-
76
-
77
-
78
-
79
-
80
-
81
-
82
-
83
-
84
-
85
-
86
-
87
-
88
-
89
-
90
-
91
-
92
-
93
-
94
-
95
-
96
-
97
-
98
-
99
-
100
-
101
-
102
-
103
-
104
-
105
-
106
-
107
-
108
-
109
-
110
-
111
-
112
-
113
-
114
-
115
-
116
-
117
-
118
-
119
-
120
-
121
-
122
-
123
-
124
-
125
-
126
-
127
-
128
-
129
-
130
-
131
-
132
-
133
-
134
-
135
-
136
-
137
-
138
-
139
-
140
-
141
-
142
-
143
-
144
-
145
-
146
-
147
-
148
-
149
-
150
-
151
-
 152
152 -
 153
153 -
 154
154 -
 155
155 -
 156
156 -
 157
157 -
 158
158 -
 159
159 -
 160
160 -
 161
161 -
 162
162 -
 163
163 -
 164
164 -
 165
165 -
 166
166 -
 167
167 -
 168
168 -
 169
169 -
 170
170 -
 171
171 -
 172
172 -
173
-
174
-
175
-
176
-
177
-
178
-
179
-
180
-
181
-
182
-
183
-
184
 |
 |

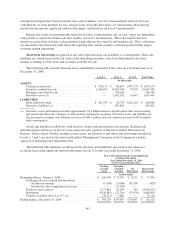
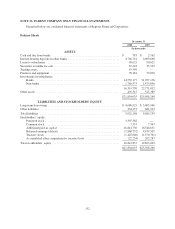
NOTE 26. PARENT COMPANY ONLY FINANCIAL STATEMENTS
Presented below are condensed financial statements of Regions Financial Corporation:
Balance Sheets
December 31
2008 2007
(In thousands)
ASSETS
Cash and due from banks .............................................. $ 783 $ 2,162
Interest-bearing deposits in other banks ................................... 4,766,741 2,003,660
Loans to subsidiaries .................................................. 90,625 90,625
Securities available for sale ............................................. 67,241 35,522
Trading assets ....................................................... 19,399 —
Premises and equipment ............................................... 78,181 79,878
Investments in subsidiaries:
Banks .......................................................... 14,559,177 21,297,176
Non-banks ...................................................... 1,760,573 1,473,856
16,319,750 22,771,032
Other assets ......................................................... 491,315 525,389
$21,834,035 $25,508,268
LIABILITIES AND STOCKHOLDERS’ EQUITY
Long-term borrowings ................................................. $ 4,686,925 $ 5,003,946
Other liabilities ...................................................... 334,273 681,293
Total liabilities ...................................................... 5,021,198 5,685,239
Stockholders’ equity:
Preferred stock ................................................... 3,307,382 —
Common stock ................................................... 7,357 7,347
Additional paid-in capital .......................................... 16,814,730 16,544,651
Retained earnings (deficit) ......................................... (1,868,752) 4,439,505
Treasury stock ................................................... (1,425,646) (1,370,761)
Accumulated other comprehensive income (loss) ....................... (22,234) 202,287
Total stockholders’ equity .............................................. 16,812,837 19,823,029
$21,834,035 $25,508,268
152