Regions Bank 2008 Annual Report Download - page 99
Download and view the complete annual report
Please find page 99 of the 2008 Regions Bank annual report below. You can navigate through the pages in the report by either clicking on the pages listed below, or by using the keyword search tool below to find specific information within the annual report.-
 1
1 -
2
-
3
-
4
-
5
-
6
-
7
-
8
-
9
-
10
-
11
-
12
-
13
-
14
-
15
-
16
-
17
-
18
-
19
-
20
-
21
-
22
-
23
-
24
-
25
-
26
-
27
-
28
-
29
-
30
-
31
-
32
-
33
-
34
-
35
-
36
-
37
-
38
-
39
-
40
-
41
-
42
-
43
-
44
-
45
-
46
-
47
-
48
-
49
-
50
-
51
-
52
-
53
-
54
-
55
-
56
-
57
-
58
-
59
-
60
-
61
-
62
-
63
-
64
-
65
-
66
-
67
-
68
-
69
-
70
-
71
-
72
-
73
-
74
-
75
-
76
-
77
-
78
-
79
-
80
-
81
-
82
-
83
-
84
-
85
-
86
-
87
-
88
-
 89
89 -
 90
90 -
 91
91 -
 92
92 -
 93
93 -
 94
94 -
 95
95 -
 96
96 -
 97
97 -
 98
98 -
 99
99 -
 100
100 -
 101
101 -
 102
102 -
 103
103 -
 104
104 -
 105
105 -
 106
106 -
 107
107 -
 108
108 -
 109
109 -
110
-
111
-
112
-
113
-
114
-
115
-
116
-
117
-
118
-
119
-
120
-
121
-
122
-
123
-
124
-
125
-
126
-
127
-
128
-
129
-
130
-
131
-
132
-
133
-
134
-
135
-
136
-
137
-
138
-
139
-
140
-
141
-
142
-
143
-
144
-
145
-
146
-
147
-
148
-
149
-
150
-
151
-
152
-
153
-
154
-
155
-
156
-
157
-
158
-
159
-
160
-
161
-
162
-
163
-
164
-
165
-
166
-
167
-
168
-
169
-
170
-
171
-
172
-
173
-
174
-
175
-
176
-
177
-
178
-
179
-
180
-
181
-
182
-
183
-
184
 |
 |

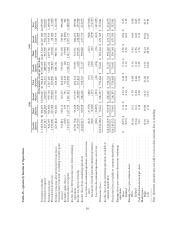
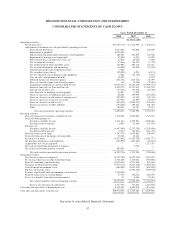
Table 25—Quarterly Results of Operations
2008 2007
Fourth
Quarter
Third
Quarter
Second
Quarter
First
Quarter
Fourth
Quarter
Third
Quarter
Second
Quarter
First
Quarter
(In thousands, except per share data)
Total interest income ............................... $1,581,506 $1,568,405 $1,630,667 $1,782,812 $1,934,168 $2,013,120 $2,027,480 $2,099,895
Total interest expense .............................. 657,347 646,803 650,957 765,327 889,956 933,339 922,145 930,857
Net interest income ................................ 924,159 921,602 979,710 1,017,485 1,044,212 1,079,781 1,105,335 1,169,038
Provision for loan losses ............................ 1,150,000 417,000 309,000 181,000 358,000 90,000 60,000 47,000
Net interest income after provision for loan losses ........ (225,841) 504,602 670,710 836,485 686,212 989,781 1,045,335 1,122,038
Total non-interest income, excluding securities gains
(losses) ........................................ 701,891 719,174 743,177 816,494 733,023 705,150 729,607 696,608
Securities gains (losses) ............................. (105) 165 792 91,643 (45) 23,994 (32,806) 304
Total non-interest expense ........................... 7,272,679 1,127,713 1,141,124 1,250,098 1,348,256 1,145,394 1,057,735 1,108,966
Income (loss) before income taxes from continuing
operations ...................................... (6,796,734) 96,228 273,555 494,524 70,934 573,531 684,401 709,984
Income tax expense (benefit) ......................... (578,707) 5,870 66,909 157,814 (181) 179,291 230,669 235,908
Income (loss) from continuing operations ............... (6,218,027) 90,358 206,646 336,710 71,115 394,240 453,732 474,076
Loss from discontinued operations before income
taxes ...................................... (431) (17,501) (406) (67) (765) (122) (682) (215,818)
Income tax benefit from discontinued operations ..... (162) (6,604) (153) (25) (291) (46) (259) (74,723)
Loss from discontinued operations, net of tax ........ (269) (10,897) (253) (42) (474) (76) (423) (141,095)
Net income (loss) .................................. $(6,218,296) $ 79,461 $ 206,393 $ 336,668 $ 70,641 $ 394,164 $ 453,309 $ 332,981
Income (loss) from continuing operations available to
common shareholders ............................ $(6,244,263) $ 90,358 $ 206,646 $ 336,710 $ 71,115 $ 394,240 $ 453,732 $ 474,076
Net income (loss) available to common shareholders ...... $(6,244,532) $ 79,461 $ 206,393 $ 336,668 $ 70,641 $ 394,164 $ 453,309 $ 332,981
Earnings (loss) per common share from continuing
operations:
Basic ........................................ $ (8.97) $ 0.13 $ 0.30 $ 0.48 $ 0.10 $ 0.56 $ 0.64 $ 0.65
Diluted ...................................... (8.97) 0.13 0.30 0.48 0.10 0.56 0.63 0.65
Earnings (loss) per common share:
Basic ........................................ (9.01) 0.11 0.30 0.48 0.10 0.56 0.64 0.46
Diluted ...................................... (9.01) 0.11 0.30 0.48 0.10 0.56 0.63 0.45
Cash dividends declared per share ..................... 0.10 0.10 0.38 0.38 0.38 0.36 0.36 0.36
Market price:
High ........................................ 14.50 19.80 24.31 25.84 31.23 34.44 36.66 38.17
Low ........................................ 6.85 6.41 10.31 17.90 22.84 28.90 32.87 33.83
Note: Quarterly amounts may not add to year-to-date amounts due to rounding.
89