Regions Bank 2008 Annual Report Download - page 112
Download and view the complete annual report
Please find page 112 of the 2008 Regions Bank annual report below. You can navigate through the pages in the report by either clicking on the pages listed below, or by using the keyword search tool below to find specific information within the annual report.-
 1
1 -
2
-
3
-
4
-
5
-
6
-
7
-
8
-
9
-
10
-
11
-
12
-
13
-
14
-
15
-
16
-
17
-
18
-
19
-
20
-
21
-
22
-
23
-
24
-
25
-
26
-
27
-
28
-
29
-
30
-
31
-
32
-
33
-
34
-
35
-
36
-
37
-
38
-
39
-
40
-
41
-
42
-
43
-
44
-
45
-
46
-
47
-
48
-
49
-
50
-
51
-
52
-
53
-
54
-
55
-
56
-
57
-
58
-
59
-
60
-
61
-
62
-
63
-
64
-
65
-
66
-
67
-
68
-
69
-
70
-
71
-
72
-
73
-
74
-
75
-
76
-
77
-
78
-
79
-
80
-
81
-
82
-
83
-
84
-
85
-
86
-
87
-
88
-
89
-
90
-
91
-
92
-
93
-
94
-
95
-
96
-
97
-
98
-
99
-
100
-
101
-
 102
102 -
 103
103 -
 104
104 -
 105
105 -
 106
106 -
 107
107 -
 108
108 -
 109
109 -
 110
110 -
 111
111 -
 112
112 -
 113
113 -
 114
114 -
 115
115 -
 116
116 -
 117
117 -
 118
118 -
 119
119 -
 120
120 -
 121
121 -
 122
122 -
123
-
124
-
125
-
126
-
127
-
128
-
129
-
130
-
131
-
132
-
133
-
134
-
135
-
136
-
137
-
138
-
139
-
140
-
141
-
142
-
143
-
144
-
145
-
146
-
147
-
148
-
149
-
150
-
151
-
152
-
153
-
154
-
155
-
156
-
157
-
158
-
159
-
160
-
161
-
162
-
163
-
164
-
165
-
166
-
167
-
168
-
169
-
170
-
171
-
172
-
173
-
174
-
175
-
176
-
177
-
178
-
179
-
180
-
181
-
182
-
183
-
184
 |
 |
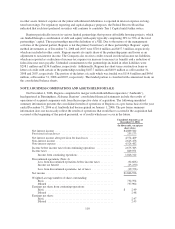
calculating prepayment rates, Regions utilizes a variety of prepayment models depending on the loan type and
specific transaction requirements. The models used by Regions include the constant prepayment rate model
(CPR) and the Bond Market Trade Association’s Mortgaged Asset-Backed Securities Division’s prepayment
model (PSA). On a quarterly basis, Regions ensures that any retained interests are valued appropriately in the
consolidated financial statements. Management reviews the historical performance of each retained interest and
the assumptions used to project future cash flows. Assumptions are revised if past performance and future
expectations dictate. The present value of cash flows is then recalculated based on the revised assumptions.
Amounts capitalized for the right to service mortgage loans are amortized as a component of other
non-interest expense over the estimated remaining lives of the loans, considering appropriate prepayment
assumptions. Mortgage servicing rights are recorded at the lower of aggregate cost or estimated fair value on a
stratified basis as further discussed in Note 23. The estimated fair value of mortgage servicing rights is estimated
using various assumptions including future cash flows, market discount rates, as well as expected prepayment
rates, servicing costs and other factors. Changes in these factors could result in impairment of the servicing asset
and a charge against earnings. For purposes of evaluating impairment, the Company stratifies its mortgage
servicing portfolio on the basis of certain risk characteristics, including loan type and interest rate. Impairment
related to mortgage servicing rights is recorded in other non-interest expense. Contractually specified servicing
fees, late fees and other ancillary income related to the servicing of mortgage loans are recorded in mortgage
income. Refer to Note 8 for further discussion of mortgage servicing rights.
Effective January 1, 2009, the Company made an election allowed by Statement of Financial Accounting
Standards No. 156, “Accounting for Servicing of Financial Assets, an Amendment of FASB Statement No. 140”
(“FAS 156”) to prospectively change the policy for accounting for mortgage servicing rights from the
amortization method to the fair value measurement method. The fair value measurement method requires the
servicing assets and liabilities to be measured at fair value each period with an offset to income. The adoption did
not have a material impact on the consolidated financial statements.
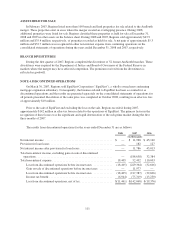
PREMISES AND EQUIPMENT
Premises and equipment are stated at cost, less accumulated depreciation and amortization, as applicable.
Depreciation expense is computed using the straight-line method over the estimated useful lives of the assets.
Leasehold improvements are amortized using the straight-line method over the estimated useful lives of the
improvements (or the terms of the leases, if shorter). Generally, premises and leasehold improvements are
depreciated or amortized over 10-40 years. Furniture and equipment are generally depreciated or amortized over
3-12 years.
Regions enters into lease transactions for the right to use assets. These leases vary in term and, from time to
time, include incentives and/or rent escalations. Examples of incentives include periods of “free” rent and
leasehold improvement incentives. Regions recognizes incentives and escalations on a straight-line basis over the
lease term as a reduction of or increase to rent expense, as applicable, in net occupancy expense on the
consolidated statements of operations.
INTANGIBLE ASSETS
Intangible assets include goodwill, which is the excess of cost over the fair value of net assets of acquired
businesses, and other identifiable intangibles. Other identifiable intangible assets include the following: (1) core
deposit intangible assets, which are amounts recorded related to the value of acquired indeterminate-maturity
deposits, (2) amounts capitalized related to the value of acquired customer relationships and (3) amounts
recorded related to employment agreements with certain individuals of acquired entities. Core deposit intangibles
and most other identifiable intangibles are amortized on an accelerated basis over their expected useful lives.
102