Regions Bank 2008 Annual Report Download - page 141
Download and view the complete annual report
Please find page 141 of the 2008 Regions Bank annual report below. You can navigate through the pages in the report by either clicking on the pages listed below, or by using the keyword search tool below to find specific information within the annual report.-
 1
1 -
2
-
3
-
4
-
5
-
6
-
7
-
8
-
9
-
10
-
11
-
12
-
13
-
14
-
15
-
16
-
17
-
18
-
19
-
20
-
21
-
22
-
23
-
24
-
25
-
26
-
27
-
28
-
29
-
30
-
31
-
32
-
33
-
34
-
35
-
36
-
37
-
38
-
39
-
40
-
41
-
42
-
43
-
44
-
45
-
46
-
47
-
48
-
49
-
50
-
51
-
52
-
53
-
54
-
55
-
56
-
57
-
58
-
59
-
60
-
61
-
62
-
63
-
64
-
65
-
66
-
67
-
68
-
69
-
70
-
71
-
72
-
73
-
74
-
75
-
76
-
77
-
78
-
79
-
80
-
81
-
82
-
83
-
84
-
85
-
86
-
87
-
88
-
89
-
90
-
91
-
92
-
93
-
94
-
95
-
96
-
97
-
98
-
99
-
100
-
101
-
102
-
103
-
104
-
105
-
106
-
107
-
108
-
109
-
110
-
111
-
112
-
113
-
114
-
115
-
116
-
117
-
118
-
119
-
120
-
121
-
122
-
123
-
124
-
125
-
126
-
127
-
128
-
129
-
130
-
 131
131 -
 132
132 -
 133
133 -
 134
134 -
 135
135 -
 136
136 -
 137
137 -
 138
138 -
 139
139 -
 140
140 -
 141
141 -
 142
142 -
 143
143 -
 144
144 -
 145
145 -
 146
146 -
 147
147 -
 148
148 -
 149
149 -
 150
150 -
 151
151 -
152
-
153
-
154
-
155
-
156
-
157
-
158
-
159
-
160
-
161
-
162
-
163
-
164
-
165
-
166
-
167
-
168
-
169
-
170
-
171
-
172
-
173
-
174
-
175
-
176
-
177
-
178
-
179
-
180
-
181
-
182
-
183
-
184
 |
 |

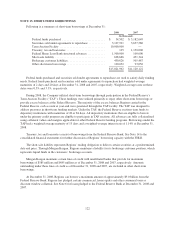
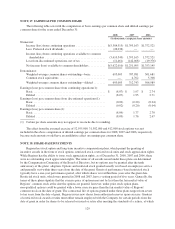
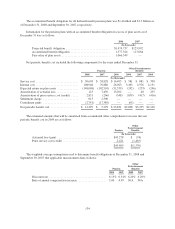
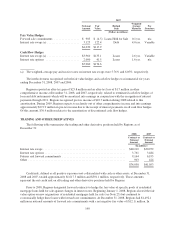
Refer to Note 1 for a discussion of the methodologies used to derive the underlying assumptions used in the
Black-Scholes option pricing model. The expected dividend yield increased in 2008 due to the decreased stock
price on the date of the grant. During 2008, expected volatility increased based upon increases in the historical
volatility of Regions’ stock price and the implied volatility measurements from traded options on the Company’s
stock. The risk-free interest rate decreased in 2008 due to the lower interest rate environment in 2008. The
expected option life has been impacted by the decrease in contractual life on new grants from ten years
(historically) to seven years for grants issued between 2004 and 2006. Option grants issued in 2007 and 2008
have a contractual life of ten years and, therefore, the expected option life increased for these grants.
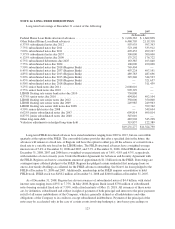
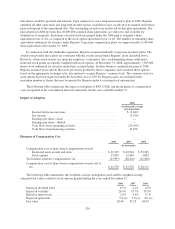
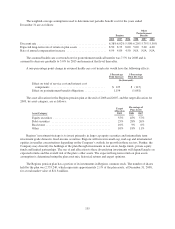
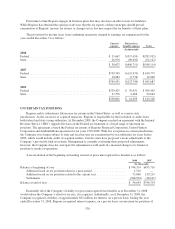
The following table summarizes the activity for 2008, 2007 and 2006 related to stock options:
Number of
Options
Weighted-
Average
Exercise
Price
Aggregate
Intrinsic
Value (In
Thousands)
Weighted-
Average
Remaining
Contractual
Term
Balance at December 31, 2005 ......................... 33,590,080 $27.26
Options assumed through acquisitions ............... 25,663,411 29.20
Granted ....................................... 968,706 35.14
Exercised ...................................... (10,981,946) 26.62
Canceled/Forfeited .............................. (435,104) 22.17
Balance at December 31, 2006 ......................... 48,805,147 $28.97 $413,288 6.02 yrs.
Granted ....................................... 4,916,960 35.08
Exercised ...................................... (3,992,885) 26.67
Canceled/Forfeited .............................. (1,685,015) 31.18
Outstanding at December 31, 2007 ...................... 48,044,207 $29.71 $ 12,045 5.19 yrs.
Granted ....................................... 10,011,105 21.57
Exercised ...................................... (90,801) 17.94
Canceled/Forfeited .............................. (5,009,213) 29.51
Outstanding at December 31, 2008 ...................... 52,955,298 $28.22 $ — 5.53 yrs.
Exercisable at December 31, 2008 ...................... 41,238,392 $29.30 $ — 4.55 yrs.
For the years ended December 31, 2008, 2007 and 2006 the total intrinsic value of options exercised was
zero, $33.3 million and $104.0 million, respectively.
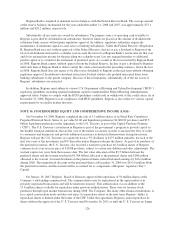
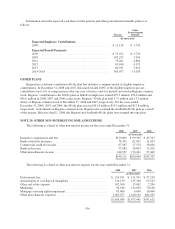
Restricted stock award and unit activity for 2008, 2007 and 2006 is summarized as follows:
Number of
Shares/Units
Weighted-Average
Fair Value
(Grant Date)
Non-vested at December 31, 2005 ...................................... 3,362,995 $31.39
Granted ....................................................... 1,740,227 35.21
Vested ........................................................ (1,524,579) 31.38
Forfeited ...................................................... (288,054) 32.25
Non-vested at December 31, 2006 ...................................... 3,290,589 $33.34
Granted ....................................................... 2,622,781 32.50
Vested ........................................................ (1,823,098) 33.19
Forfeited ...................................................... (439,218) 35.07
Non-vested at December 31, 2007 ...................................... 3,651,054 $32.60
Granted ....................................................... 1,704,599 20.99
Vested ........................................................ (799,276) 34.07
Forfeited ...................................................... (432,466) 31.11
Non-vested at December 31, 2008 ...................................... 4,123,911 $27.67
131