Regions Bank 2008 Annual Report Download - page 131
Download and view the complete annual report
Please find page 131 of the 2008 Regions Bank annual report below. You can navigate through the pages in the report by either clicking on the pages listed below, or by using the keyword search tool below to find specific information within the annual report.-
 1
1 -
2
-
3
-
4
-
5
-
6
-
7
-
8
-
9
-
10
-
11
-
12
-
13
-
14
-
15
-
16
-
17
-
18
-
19
-
20
-
21
-
22
-
23
-
24
-
25
-
26
-
27
-
28
-
29
-
30
-
31
-
32
-
33
-
34
-
35
-
36
-
37
-
38
-
39
-
40
-
41
-
42
-
43
-
44
-
45
-
46
-
47
-
48
-
49
-
50
-
51
-
52
-
53
-
54
-
55
-
56
-
57
-
58
-
59
-
60
-
61
-
62
-
63
-
64
-
65
-
66
-
67
-
68
-
69
-
70
-
71
-
72
-
73
-
74
-
75
-
76
-
77
-
78
-
79
-
80
-
81
-
82
-
83
-
84
-
85
-
86
-
87
-
88
-
89
-
90
-
91
-
92
-
93
-
94
-
95
-
96
-
97
-
98
-
99
-
100
-
101
-
102
-
103
-
104
-
105
-
106
-
107
-
108
-
109
-
110
-
111
-
112
-
113
-
114
-
115
-
116
-
117
-
118
-
119
-
120
-
 121
121 -
 122
122 -
 123
123 -
 124
124 -
 125
125 -
 126
126 -
 127
127 -
 128
128 -
 129
129 -
 130
130 -
 131
131 -
 132
132 -
 133
133 -
 134
134 -
 135
135 -
 136
136 -
 137
137 -
 138
138 -
 139
139 -
 140
140 -
 141
141 -
142
-
143
-
144
-
145
-
146
-
147
-
148
-
149
-
150
-
151
-
152
-
153
-
154
-
155
-
156
-
157
-
158
-
159
-
160
-
161
-
162
-
163
-
164
-
165
-
166
-
167
-
168
-
169
-
170
-
171
-
172
-
173
-
174
-
175
-
176
-
177
-
178
-
179
-
180
-
181
-
182
-
183
-
184
 |
 |

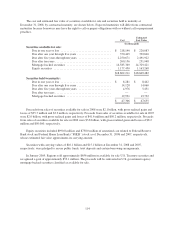
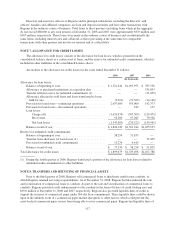
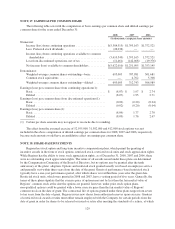
NOTE 11. FORECLOSED PROPERTIES
Other real estate acquired in foreclosure is carried at the lower of the recorded investment in the loan or fair
value less estimated cost to sell.
An analysis of foreclosed properties for the years ended December 31 follows:
2008 2007
(In thousands)
Balance at beginning of year ............................. $120,465 $ 72,663
Transfer from loans ................................ 414,202 181,988
Foreclosed property sold ............................ (233,835) (119,211)
Writedowns and partial liquidations .................... (57,871) (14,975)
122,496 47,802
Balance at end of year .................................. $242,961 $ 120,465
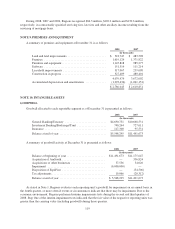
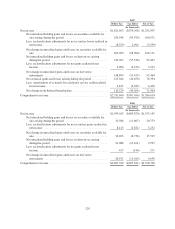
NOTE 12. DEPOSITS
The following schedule presents a detail of interest-bearing deposits at December 31:
2008 2007
(In thousands)
Savings accounts ................................... $ 3,662,949 $ 3,646,632
Interest-bearing transaction accounts ................... 15,022,207 15,846,139
Money market accounts ............................. 19,470,886 18,934,309
Money market accounts—foreign ...................... 1,812,446 3,482,603
Time deposits ..................................... 32,368,498 26,507,459
Customer deposits .............................. 72,336,986 68,417,142
Time deposits ..................................... 110,236 2,791,386
Other foreign deposits ............................... — 5,149,174
Treasury deposits ............................... 110,236 7,940,560
$72,447,222 $76,357,702
The aggregate amount of time deposits of $100,000 or more, including certificates of deposit of $100,000 or
more, was $12.7 billion at both December 31, 2008 and 2007, respectively.
The aggregate amount of maturities of all time deposits (deposits with stated maturities, consisting primarily
of certificates of deposit and IRAs) in each of the next five years is as follows: 2009–$20.4 billion; 2010–$7.0
billion; 2011–$3.4 billion; 2012–$1.4 billion; 2013–$0.2 billion; and thereafter–$0.1 billion.
During the third quarter of 2008, Regions, in an FDIC-assisted transaction, assumed approximately $900
million of deposits from Integrity Bank in Alpharetta, Georgia.
121