Regions Bank 2008 Annual Report Download - page 54
Download and view the complete annual report
Please find page 54 of the 2008 Regions Bank annual report below. You can navigate through the pages in the report by either clicking on the pages listed below, or by using the keyword search tool below to find specific information within the annual report.-
 1
1 -
2
-
3
-
4
-
5
-
6
-
7
-
8
-
9
-
10
-
11
-
12
-
13
-
14
-
15
-
16
-
17
-
18
-
19
-
20
-
21
-
22
-
23
-
24
-
25
-
26
-
27
-
28
-
29
-
30
-
31
-
32
-
33
-
34
-
35
-
36
-
37
-
38
-
39
-
40
-
41
-
42
-
43
-
 44
44 -
 45
45 -
 46
46 -
 47
47 -
 48
48 -
 49
49 -
 50
50 -
 51
51 -
 52
52 -
 53
53 -
 54
54 -
 55
55 -
 56
56 -
 57
57 -
 58
58 -
 59
59 -
 60
60 -
 61
61 -
 62
62 -
 63
63 -
 64
64 -
65
-
66
-
67
-
68
-
69
-
70
-
71
-
72
-
73
-
74
-
75
-
76
-
77
-
78
-
79
-
80
-
81
-
82
-
83
-
84
-
85
-
86
-
87
-
88
-
89
-
90
-
91
-
92
-
93
-
94
-
95
-
96
-
97
-
98
-
99
-
100
-
101
-
102
-
103
-
104
-
105
-
106
-
107
-
108
-
109
-
110
-
111
-
112
-
113
-
114
-
115
-
116
-
117
-
118
-
119
-
120
-
121
-
122
-
123
-
124
-
125
-
126
-
127
-
128
-
129
-
130
-
131
-
132
-
133
-
134
-
135
-
136
-
137
-
138
-
139
-
140
-
141
-
142
-
143
-
144
-
145
-
146
-
147
-
148
-
149
-
150
-
151
-
152
-
153
-
154
-
155
-
156
-
157
-
158
-
159
-
160
-
161
-
162
-
163
-
164
-
165
-
166
-
167
-
168
-
169
-
170
-
171
-
172
-
173
-
174
-
175
-
176
-
177
-
178
-
179
-
180
-
181
-
182
-
183
-
184
 |
 |

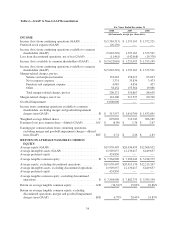
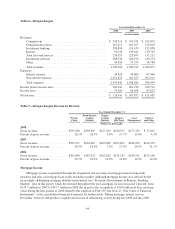
Table 6—Morgan Keegan
Year Ended December 31
2008 2007 2006
(In thousands)
Revenues:
Commissions ........................................... $ 249,216 $ 314,541 $ 242,872
Principal transactions .................................... 267,417 181,567 156,019
Investment banking ...................................... 209,898 191,479 152,858
Interest ................................................ 95,136 149,011 139,745
Trust fees and services ................................... 230,553 225,845 131,215
Investment advisory ..................................... 206,536 184,194 149,174
Other ................................................. 41,426 53,555 56,788
Total revenues .......................................... 1,300,182 1,300,192 1,028,671
Expenses:
Interest expense ......................................... 45,828 90,609 87,046
Non-interest expense ..................................... 1,051,813 947,673 702,913
Total expenses .......................................... 1,097,641 1,038,282 789,959
Income before income taxes ................................... 202,541 261,910 238,712
Income taxes ............................................... 74,200 96,038 87,625
Net income ................................................ $ 128,341 $ 165,872 $ 151,087
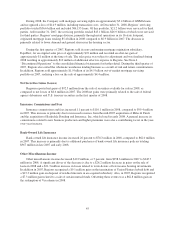
Table 7—Morgan Keegan Revenue by Division
Year Ended December 31
Private
Client
Fixed-Income
Capital
Markets
Equity
Capital
Markets
Regions
MK Trust
Asset
Management
Interest
and Other
(Dollars in thousands)
2008
Gross revenue ................... $339,438 $369,887 $127,929 $230,553 $177,352 $ 55,023
Percent of gross revenue ........... 26.1% 28.5% 9.8% 17.7% 13.6% 4.3%
2007
Gross revenue ................... $393,511 $244,407 $103,289 $225,845 $188,905 $144,235
Percent of gross revenue ........... 30.3% 18.8% 7.9% 17.4% 14.5% 11.1%
2006
Gross revenue ................... $305,098 $187,425 $103,282 $131,215 $149,511 $152,140
Percent of gross revenue ........... 29.7% 18.2% 10.0% 12.8% 14.5% 14.8%
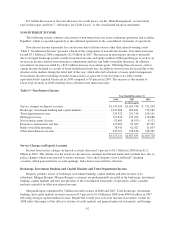
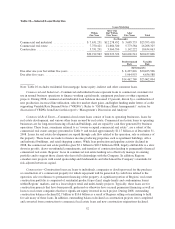
Mortgage Income
Mortgage income is generated through the origination and servicing of mortgage loans for long-term
investors and sales of mortgage loans in the secondary market. Although mortgage income was affected by the
increasingly challenging mortgage industry environment (see “Economic Environment in Regions’ Banking
Markets” later in this report) which deteriorated throughout the year, mortgage income increased 1 percent, from
$135.7 million in 2007 to $137.7 million in 2008 due in part to the recognition of $10.0 million in loan servicing
value during the first quarter of 2008 related to the adoption of FAS 159. See Note 23 “Fair Value of Financial
Instruments” to the consolidated financial statements for further detail. Falling mortgage interest rates in
December, however, did produce a significant increase in refinancing activity during late 2008 and into 2009.
44