Regions Bank 2008 Annual Report Download - page 146
Download and view the complete annual report
Please find page 146 of the 2008 Regions Bank annual report below. You can navigate through the pages in the report by either clicking on the pages listed below, or by using the keyword search tool below to find specific information within the annual report.-
 1
1 -
2
-
3
-
4
-
5
-
6
-
7
-
8
-
9
-
10
-
11
-
12
-
13
-
14
-
15
-
16
-
17
-
18
-
19
-
20
-
21
-
22
-
23
-
24
-
25
-
26
-
27
-
28
-
29
-
30
-
31
-
32
-
33
-
34
-
35
-
36
-
37
-
38
-
39
-
40
-
41
-
42
-
43
-
44
-
45
-
46
-
47
-
48
-
49
-
50
-
51
-
52
-
53
-
54
-
55
-
56
-
57
-
58
-
59
-
60
-
61
-
62
-
63
-
64
-
65
-
66
-
67
-
68
-
69
-
70
-
71
-
72
-
73
-
74
-
75
-
76
-
77
-
78
-
79
-
80
-
81
-
82
-
83
-
84
-
85
-
86
-
87
-
88
-
89
-
90
-
91
-
92
-
93
-
94
-
95
-
96
-
97
-
98
-
99
-
100
-
101
-
102
-
103
-
104
-
105
-
106
-
107
-
108
-
109
-
110
-
111
-
112
-
113
-
114
-
115
-
116
-
117
-
118
-
119
-
120
-
121
-
122
-
123
-
124
-
125
-
126
-
127
-
128
-
129
-
130
-
131
-
132
-
133
-
134
-
135
-
 136
136 -
 137
137 -
 138
138 -
 139
139 -
 140
140 -
 141
141 -
 142
142 -
 143
143 -
 144
144 -
 145
145 -
 146
146 -
 147
147 -
 148
148 -
 149
149 -
 150
150 -
 151
151 -
 152
152 -
 153
153 -
 154
154 -
 155
155 -
 156
156 -
157
-
158
-
159
-
160
-
161
-
162
-
163
-
164
-
165
-
166
-
167
-
168
-
169
-
170
-
171
-
172
-
173
-
174
-
175
-
176
-
177
-
178
-
179
-
180
-
181
-
182
-
183
-
184
 |
 |

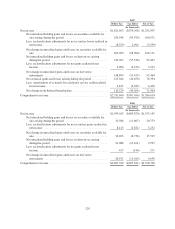
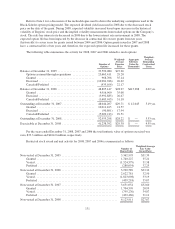
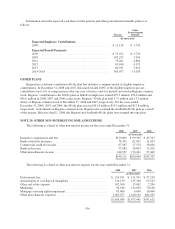
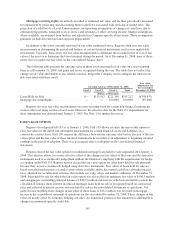
Information about the expected cash flows for the pension and other postretirement benefits plans is as
follows:
Pension
Other
Postretirement
Benefits
(In thousands)
Expected Employer Contributions:
2009 ............................................... $ 12,156 $ 5,739
Expected Benefit Payments:
2009 ............................................... $ 75,072 $ 5,739
2010 ............................................... 102,253 5,296
2011 ............................................... 79,201 4,804
2012 ............................................... 81,696 4,193
2013 ............................................... 84,951 3,616
2014-2018 .......................................... 505,077 13,039
OTHER PLANS
Regions has a defined-contribution 401(k) plan that includes a company match of eligible employee
contributions. At December 31, 2008 and 2007, this match totaled 100% of the eligible employee pre-tax
contribution (up to 6% of compensation) after one year of service and was initially invested in Regions common
stock. Regions’ contribution to the 401(k) plan on behalf of employees totaled $55.3 million, $72.4 million and
$36.6 million in 2008, 2007 and 2006, respectively. Regions’ 401(k) plan held 17.5 million and 13.3 million
shares of Regions common stock at December 31, 2008 and 2007, respectively. For the years ended
December 31, 2008, 2007 and 2006, the 401(k) plan received $11.6 million, $19.5 million and $12.8 million,
respectively, in dividends on Regions common stock. Regions also assumed the AmSouth 401(k) plan as a result
of the merger. Effective April 1, 2008, the Regions and AmSouth 401(k) plans were merged into one plan.
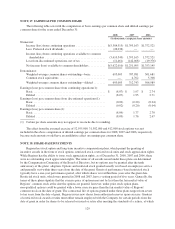
NOTE 20. OTHER NON-INTEREST INCOME AND EXPENSE
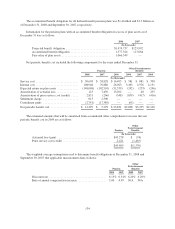
The following is a detail of other non-interest income for the years ended December 31:
2008 2007 2006
(In thousands)
Insurance commissions and fees .................................... $110,069 $ 99,365 $ 85,547
Bank-owned life insurance ......................................... 78,341 62,021 11,853
Commercial credit fee income ...................................... 67,587 57,374 38,856
Bankcard income ................................................ 33,583 26,803 12,062
Other miscellaneous income ....................................... 144,531 174,441 97,449
$434,111 $420,004 $245,767
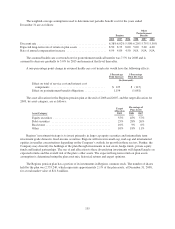
The following is a detail of other non-interest expense for the years ended December 31:
2008 2007 2006
(In thousands)
Professional fees .............................................. $ 214,191 $ 151,991 $ 97,220
Amortization of core deposit intangibles ........................... 134,139 155,346 63,523
Other real estate expense ....................................... 102,766 15,862 2,206
Marketing ................................................... 96,916 134,050 70,198
Mortgage servicing rights impairment ............................. 85,000 6,000 16,000
Other miscellaneous expenses ................................... 1,025,977 1,010,192 682,505
$1,658,989 $1,473,441 $931,652
136