Regions Bank 2008 Annual Report Download - page 109
Download and view the complete annual report
Please find page 109 of the 2008 Regions Bank annual report below. You can navigate through the pages in the report by either clicking on the pages listed below, or by using the keyword search tool below to find specific information within the annual report.-
 1
1 -
2
-
3
-
4
-
5
-
6
-
7
-
8
-
9
-
10
-
11
-
12
-
13
-
14
-
15
-
16
-
17
-
18
-
19
-
20
-
21
-
22
-
23
-
24
-
25
-
26
-
27
-
28
-
29
-
30
-
31
-
32
-
33
-
34
-
35
-
36
-
37
-
38
-
39
-
40
-
41
-
42
-
43
-
44
-
45
-
46
-
47
-
48
-
49
-
50
-
51
-
52
-
53
-
54
-
55
-
56
-
57
-
58
-
59
-
60
-
61
-
62
-
63
-
64
-
65
-
66
-
67
-
68
-
69
-
70
-
71
-
72
-
73
-
74
-
75
-
76
-
77
-
78
-
79
-
80
-
81
-
82
-
83
-
84
-
85
-
86
-
87
-
88
-
89
-
90
-
91
-
92
-
93
-
94
-
95
-
96
-
97
-
98
-
 99
99 -
 100
100 -
 101
101 -
 102
102 -
 103
103 -
 104
104 -
 105
105 -
 106
106 -
 107
107 -
 108
108 -
 109
109 -
 110
110 -
 111
111 -
 112
112 -
 113
113 -
 114
114 -
 115
115 -
 116
116 -
 117
117 -
 118
118 -
 119
119 -
120
-
121
-
122
-
123
-
124
-
125
-
126
-
127
-
128
-
129
-
130
-
131
-
132
-
133
-
134
-
135
-
136
-
137
-
138
-
139
-
140
-
141
-
142
-
143
-
144
-
145
-
146
-
147
-
148
-
149
-
150
-
151
-
152
-
153
-
154
-
155
-
156
-
157
-
158
-
159
-
160
-
161
-
162
-
163
-
164
-
165
-
166
-
167
-
168
-
169
-
170
-
171
-
172
-
173
-
174
-
175
-
176
-
177
-
178
-
179
-
180
-
181
-
182
-
183
-
184
 |
 |

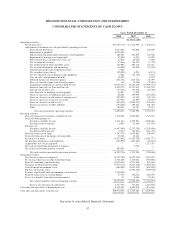
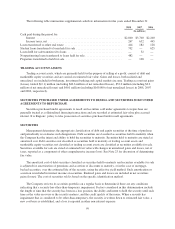
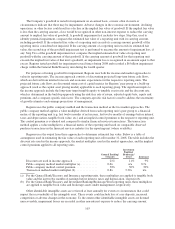
The following table summarizes supplemental cash flow information for the years ended December 31:
2008 2007 2006
(In millions)
Cash paid during the period for:
Interest .......................................................... $2,800 $3,700 $2,200
Income taxes, net .................................................. 267 652 445
Loans transferred to other real estate ....................................... 414 182 128
Student loans transferred to loans held for sale ............................... 792 — 625
Loans held for sale transferred to loans ..................................... — 52 —
Nonperforming loans transferred to loans held for sale ......................... 482 — —
Properties transferred to held for sale ...................................... — 108 —
TRADING ACCOUNT ASSETS
Trading account assets, which are primarily held for the purpose of selling at a profit, consist of debt and
marketable equity securities and are carried at estimated fair value. Gains and losses, both realized and
unrealized, are included in brokerage, investment banking and capital markets income. Trading account net gains
(losses) totaled $(2.1) million (including $42.6 million of net unrealized losses), $32.0 million (including $2.2
million of net unrealized losses) and $40.1 million (including $169,000 of net unrealized losses) in 2008, 2007
and 2006, respectively.
SECURITIES PURCHASED UNDER AGREEMENTS TO RESELL AND SECURITIES SOLD UNDER
AGREEMENTS TO REPURCHASE
Securities purchased under agreements to resell and securities sold under agreements to repurchase are
generally treated as collateralized financing transactions and are recorded at estimated fair value plus accrued
interest. It is Regions’ policy to take possession of securities purchased under resell agreements.
SECURITIES
Management determines the appropriate classification of debt and equity securities at the time of purchase
and periodically re-evaluates such designations. Debt securities are classified as securities held to maturity when
the Company has the intent and ability to hold the securities to maturity. Securities held to maturity are stated at
amortized cost. Debt securities not classified as securities held to maturity or trading account assets and
marketable equity securities not classified as trading account assets are classified as securities available for sale.
Securities available for sale are stated at estimated fair value with changes in unrealized gains and losses, net of
taxes, reported as a component of other comprehensive income (loss). See Note 23 for discussion of determining
fair value.
The amortized cost of debt securities classified as securities held to maturity and securities available for sale
is adjusted for amortization of premiums and accretion of discounts to maturity, or in the case of mortgage-
backed securities, over the estimated life of the security, using the effective yield method. Such amortization or
accretion is included in interest income on securities. Realized gains and losses are included in net securities
gains (losses). The cost of securities sold is based on the specific identification method.
The Company reviews its securities portfolio on a regular basis to determine if there are any conditions
indicating that a security has other-than-temporary impairment. Factors considered in this determination include
the length of time that the security has been in a loss position, the ability and intent to hold the security until such
time as the value recovers or the security matures, and the credit quality of the issuer. When a security has
impairment that is considered to be other-than-temporary, the security is written down to estimated fair value, a
new cost basis is established, and a loss is reported in other non-interest expense.
99