Regions Bank 2008 Annual Report Download - page 68
Download and view the complete annual report
Please find page 68 of the 2008 Regions Bank annual report below. You can navigate through the pages in the report by either clicking on the pages listed below, or by using the keyword search tool below to find specific information within the annual report.-
 1
1 -
2
-
3
-
4
-
5
-
6
-
7
-
8
-
9
-
10
-
11
-
12
-
13
-
14
-
15
-
16
-
17
-
18
-
19
-
20
-
21
-
22
-
23
-
24
-
25
-
26
-
27
-
28
-
29
-
30
-
31
-
32
-
33
-
34
-
35
-
36
-
37
-
38
-
39
-
40
-
41
-
42
-
43
-
44
-
45
-
46
-
47
-
48
-
49
-
50
-
51
-
52
-
53
-
54
-
55
-
56
-
57
-
 58
58 -
 59
59 -
 60
60 -
 61
61 -
 62
62 -
 63
63 -
 64
64 -
 65
65 -
 66
66 -
 67
67 -
 68
68 -
 69
69 -
 70
70 -
 71
71 -
 72
72 -
 73
73 -
 74
74 -
 75
75 -
 76
76 -
 77
77 -
 78
78 -
79
-
80
-
81
-
82
-
83
-
84
-
85
-
86
-
87
-
88
-
89
-
90
-
91
-
92
-
93
-
94
-
95
-
96
-
97
-
98
-
99
-
100
-
101
-
102
-
103
-
104
-
105
-
106
-
107
-
108
-
109
-
110
-
111
-
112
-
113
-
114
-
115
-
116
-
117
-
118
-
119
-
120
-
121
-
122
-
123
-
124
-
125
-
126
-
127
-
128
-
129
-
130
-
131
-
132
-
133
-
134
-
135
-
136
-
137
-
138
-
139
-
140
-
141
-
142
-
143
-
144
-
145
-
146
-
147
-
148
-
149
-
150
-
151
-
152
-
153
-
154
-
155
-
156
-
157
-
158
-
159
-
160
-
161
-
162
-
163
-
164
-
165
-
166
-
167
-
168
-
169
-
170
-
171
-
172
-
173
-
174
-
175
-
176
-
177
-
178
-
179
-
180
-
181
-
182
-
183
-
184
 |
 |

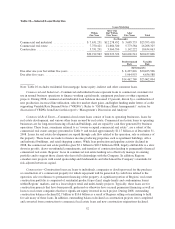
DEPOSITS
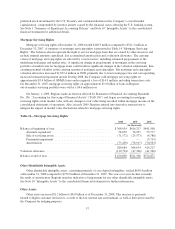
Deposits are Regions’ primary source of funds, providing funding for 75 percent of average interest-earning
assets in 2008 and 82 percent in 2007. Table 15 “Deposits” details year-over-year deposits on a period-ending
basis. Total deposits as of year-end 2008 decreased $3.9 billion, or 4.1 percent, compared to year-end 2007,
driven lower mainly by reduced use of wholesale deposit sources used for overnight funding purposes. More
specifically, Regions reduced its usage of foreign deposits (which Regions uses as a source of short-term
wholesale funding) in 2008, due to growth in customer deposits.
Customer deposits, which are total deposits excluding deposits used for treasury management purposes as
described above, increased by 4.6 percent to $90.8 billion on an ending basis during 2008. Time deposits (e.g.,
certificates of deposit) were the main source of growth, while non-interest bearing demand and domestic money
market balances also grew slightly. Increases in time deposits were offset by decreases in interest-bearing
transaction accounts and foreign money market accounts. Deposit disintermediation through a flight to quality,
such as Treasury securities, exerted pressure on bank deposits industry-wide in 2008. Furthermore, during the
year, Regions also experienced substantial pricing strain from both community banks and some larger
competitors. However, during the fourth quarter of 2008, Regions’ time deposits and money market accounts
grew in response to customers’ desire to lock-in rates in a falling rate environment. Also a factor in overall
deposit growth, during the third quarter of 2008, Regions, in an FDIC-assisted transaction, assumed
approximately $900 million of deposits, primarily time deposits, from Integrity Bank in Alpharetta, Georgia.
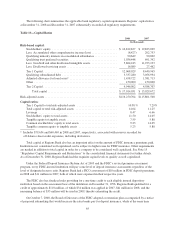
Table 15—Deposits
2008 2007 2006
(In thousands)
Non-interest bearing demand .............................. $18,456,668 $18,417,266 $ 20,175,482
Non-interest bearing demand—divestitures ................... — — 533,295
Savings ............................................... 3,662,949 3,646,632 3,882,533
Interest-bearing transaction accounts ........................ 15,022,207 15,846,139 15,899,812
Money market accounts .................................. 19,470,886 18,934,309 18,764,873
Money market accounts—foreign ........................... 1,812,446 3,482,603 4,037,384
Time deposits .......................................... 32,368,498 26,507,459 30,015,375
Interest bearing deposits—divestitures ....................... — — 2,238,072
Customer deposits ................................... 90,793,654 86,834,408 95,546,826
Time deposits .......................................... 110,236 2,791,386 1,170,033
Other foreign deposits .................................... — 5,149,174 4,511,110
Treasury deposits .................................... 110,236 7,940,560 5,681,143
Total deposits .......................................... $90,903,890 $94,774,968 $101,227,969
Low cost deposits ....................................... $58,425,156 $60,326,949 $ 65,531,451
Regions competes with other banking and financial services companies for a share of the deposit market.
Regions’ ability to compete in the deposit market depends heavily on the pricing of its deposits and how
effectively the Company meets customers’ needs. Regions employs various means to meet those needs and
enhance competitiveness, such as providing a high level of customer service, competitive pricing and expanding
the traditional branch network to provide convenient branch locations for its customers. Regions also services
customers through providing centralized, high-quality telephone banking services and alternative product
delivery channels such as internet banking. During 2008, the banking industry experienced very high deposit
pricing due to liquidity concerns, thereby accentuating pricing pressure on Regions and the industry as a whole.
58