Regions Bank 2008 Annual Report Download - page 49
Download and view the complete annual report
Please find page 49 of the 2008 Regions Bank annual report below. You can navigate through the pages in the report by either clicking on the pages listed below, or by using the keyword search tool below to find specific information within the annual report.-
 1
1 -
2
-
3
-
4
-
5
-
6
-
7
-
8
-
9
-
10
-
11
-
12
-
13
-
14
-
15
-
16
-
17
-
18
-
19
-
20
-
21
-
22
-
23
-
24
-
25
-
26
-
27
-
28
-
29
-
30
-
31
-
32
-
33
-
34
-
35
-
36
-
37
-
38
-
 39
39 -
 40
40 -
 41
41 -
 42
42 -
 43
43 -
 44
44 -
 45
45 -
 46
46 -
 47
47 -
 48
48 -
 49
49 -
 50
50 -
 51
51 -
 52
52 -
 53
53 -
 54
54 -
 55
55 -
 56
56 -
 57
57 -
 58
58 -
 59
59 -
60
-
61
-
62
-
63
-
64
-
65
-
66
-
67
-
68
-
69
-
70
-
71
-
72
-
73
-
74
-
75
-
76
-
77
-
78
-
79
-
80
-
81
-
82
-
83
-
84
-
85
-
86
-
87
-
88
-
89
-
90
-
91
-
92
-
93
-
94
-
95
-
96
-
97
-
98
-
99
-
100
-
101
-
102
-
103
-
104
-
105
-
106
-
107
-
108
-
109
-
110
-
111
-
112
-
113
-
114
-
115
-
116
-
117
-
118
-
119
-
120
-
121
-
122
-
123
-
124
-
125
-
126
-
127
-
128
-
129
-
130
-
131
-
132
-
133
-
134
-
135
-
136
-
137
-
138
-
139
-
140
-
141
-
142
-
143
-
144
-
145
-
146
-
147
-
148
-
149
-
150
-
151
-
152
-
153
-
154
-
155
-
156
-
157
-
158
-
159
-
160
-
161
-
162
-
163
-
164
-
165
-
166
-
167
-
168
-
169
-
170
-
171
-
172
-
173
-
174
-
175
-
176
-
177
-
178
-
179
-
180
-
181
-
182
-
183
-
184
 |
 |

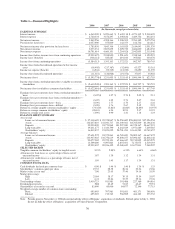
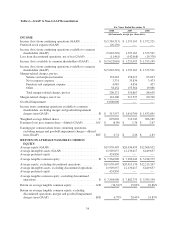
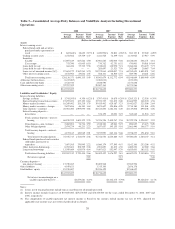
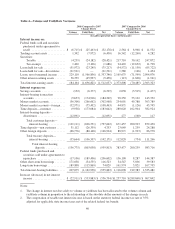
Table 3—Consolidated Average Daily Balances and Yield/Rate Analysis Including Discontinued
Operations
2008 2007 2006
Average
Balance
Income/
Expense
Yield/
Rate
Average
Balance
Income/
Expense
Yield/
Rate
Average
Balance
Income/
Expense
Yield/
Rate
(Dollars in thousands; yields on taxable-equivalent basis)
Assets
Interest-earning assets:
Federal funds sold and securities
purchased under agreements to
resell .........................$ 867,868 $ 18,623 2.15% $ 1,020,994 $ 50,801 4.98% $ 961,127 $ 39,269 4.09%
Trading account assets ............. 1,472,922 65,769 4.47 1,441,565 72,199 5.01 1,133,966 67,917 5.99
Securities:
Taxable ....................... 16,897,189 827,622 4.90 16,981,646 856,043 5.04 12,638,833 608,171 4.81
Tax-exempt .................... 753,700 61,065 8.10 736,762 62,751 8.52 470,003 50,961 10.84
Loans held for sale ................ 664,456 35,733 5.38 1,538,813 110,950 7.21 2,286,604 176,672 7.73
Loans held for sale—divestitures ..... — — — 283,697 21,521 7.59 262,884 20,087 7.64
Loans, net of unearned income(1)(2) . . 97,601,272 5,562,261 5.70 94,372,061 6,900,007 7.31 64,765,653 4,805,931 7.42
Other interest-earning assets ......... 1,872,964 29,042 1.55 588,141 38,500 6.55 589,794 40,441 6.86
Total interest-earning assets ....... 120,130,371 6,600,115 5.49 116,963,679 8,112,772 6.94 83,108,864 5,809,449 6.99
Allowance for loan losses ............. (1,413,085) (1,063,011) (833,691)
Cash and due from banks ............. 2,522,344 2,848,590 2,153,838
Other non-earning assets .............. 22,707,395 20,007,361 11,371,266
$143,947,025 $138,756,619 $95,800,277
Liabilities and Stockholders’ Equity
Interest-bearing liabilities:
Savings accounts ..................$ 3,743,595 $ 4,350 0.12% $ 3,797,413 $ 10,879 0.29% $ 3,205,123 $ 12,356 0.39%
Interest-bearing transaction accounts . . 15,057,653 127,123 0.84 15,553,355 311,672 2.00 10,664,995 168,320 1.58
Money market accounts ............ 18,269,092 326,219 1.79 19,455,402 629,187 3.23 11,442,827 325,398 2.84
Money market accounts—foreign ..... 2,827,806 46,343 1.64 3,821,607 154,806 4.05 2,714,183 111,061 4.09
Time deposits—customer ........... 28,301,406 1,099,090 3.88 28,524,600 1,282,132 4.49 22,129,808 899,208 4.06
Interest-bearing deposits—
divestitures .................... — — — 374,179 12,091 3.23 365,642 11,974 3.27
Total customer deposits—interest-
bearing ..................... 68,199,552 1,603,125 2.35 71,526,556 2,400,767 3.36 50,522,578 1,528,317 3.03
Time deposits—non customer ..... 2,082,891 74,714 3.59 1,338,340 69,961 5.23 896,835 45,673 5.09
Other foreign deposits ............ 2,074,274 46,231 2.23 3,857,657 193,155 5.01 2,081,440 106,177 5.10
Total treasury deposits—interest-
bearing ..................... 4,157,165 120,945 2.91 5,195,997 263,116 5.06 2,978,275 151,850 5.10
Total interest-bearing deposits . . . 72,356,717 1,724,070 2.38 76,722,553 2,663,883 3.47 53,500,853 1,680,167 3.14
Federal funds purchased and securities
sold under agreements to
repurchase ..................... 7,697,505 170,993 2.22 8,080,179 377,595 4.67 5,162,196 233,208 4.52
Other short-term borrowings ......... 8,703,601 198,395 2.28 1,901,897 81,872 4.30 1,089,223 42,289 3.88
Long-term borrowings ............. 13,509,689 626,976 4.64 9,697,823 552,947 5.70 6,855,601 385,152 5.62
Total interest-bearing liabilities .... 102,267,512 2,720,434 2.66 96,402,452 3,676,297 3.81 66,607,873 2,340,816 3.51
Net interest spread ............ 2.83 3.13 3.48
Customer deposits—
non-interest-bearing ............... 17,720,285 19,002,548 13,965,594
Other liabilities ..................... 4,019,821 3,315,160 2,858,178
Stockholders’ equity ................. 19,939,407 20,036,459 12,368,632
$143,947,025 $138,756,619 $95,800,277
Net interest income/margin on a
taxable-equivalent basis(3) .... $3,879,681 3.23% $4,436,475 3.79% $3,468,633 4.17%
Notes:
(1) Loans, net of unearned income include non-accrual loans for all periods presented.
(2) Interest income includes loan fees of $33,800,000, $65,673,000 and $78,360,000 for the years ended December 31, 2008, 2007 and
2006, respectively.
(3) The computation of taxable-equivalent net interest income is based on the stautory federal income tax rate of 35%, adjusted for
applicable state income taxes net of the related federal tax benefit.
39