Regions Bank 2008 Annual Report Download - page 65
Download and view the complete annual report
Please find page 65 of the 2008 Regions Bank annual report below. You can navigate through the pages in the report by either clicking on the pages listed below, or by using the keyword search tool below to find specific information within the annual report.-
 1
1 -
2
-
3
-
4
-
5
-
6
-
7
-
8
-
9
-
10
-
11
-
12
-
13
-
14
-
15
-
16
-
17
-
18
-
19
-
20
-
21
-
22
-
23
-
24
-
25
-
26
-
27
-
28
-
29
-
30
-
31
-
32
-
33
-
34
-
35
-
36
-
37
-
38
-
39
-
40
-
41
-
42
-
43
-
44
-
45
-
46
-
47
-
48
-
49
-
50
-
51
-
52
-
53
-
54
-
 55
55 -
 56
56 -
 57
57 -
 58
58 -
 59
59 -
 60
60 -
 61
61 -
 62
62 -
 63
63 -
 64
64 -
 65
65 -
 66
66 -
 67
67 -
 68
68 -
 69
69 -
 70
70 -
 71
71 -
 72
72 -
 73
73 -
 74
74 -
 75
75 -
76
-
77
-
78
-
79
-
80
-
81
-
82
-
83
-
84
-
85
-
86
-
87
-
88
-
89
-
90
-
91
-
92
-
93
-
94
-
95
-
96
-
97
-
98
-
99
-
100
-
101
-
102
-
103
-
104
-
105
-
106
-
107
-
108
-
109
-
110
-
111
-
112
-
113
-
114
-
115
-
116
-
117
-
118
-
119
-
120
-
121
-
122
-
123
-
124
-
125
-
126
-
127
-
128
-
129
-
130
-
131
-
132
-
133
-
134
-
135
-
136
-
137
-
138
-
139
-
140
-
141
-
142
-
143
-
144
-
145
-
146
-
147
-
148
-
149
-
150
-
151
-
152
-
153
-
154
-
155
-
156
-
157
-
158
-
159
-
160
-
161
-
162
-
163
-
164
-
165
-
166
-
167
-
168
-
169
-
170
-
171
-
172
-
173
-
174
-
175
-
176
-
177
-
178
-
179
-
180
-
181
-
182
-
183
-
184
 |
 |

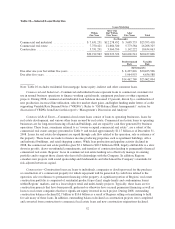
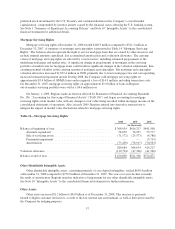
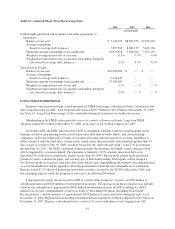
At December 31, 2008, securities available for sale included a net unrealized loss of $12.7 million, which
represented the difference between the estimated fair value of these securities as of year-end and their amortized
cost. The net unrealized loss represents $564.5 million in gross unrealized losses and $551.8 million in gross
unrealized gains. At December 31, 2007, securities available for sale included a net unrealized gain of $149.6
million, which consisted of $199.5 million of gross unrealized gains and $49.9 million in gross unrealized losses.
The net unrealized loss at December 31, 2008 reflects primarily the impact of lower interest rates and widening
of credit and liquidity spreads related to U.S. Treasury securities, Federal agency securities and mortgage-backed
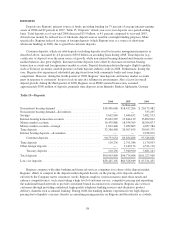
securities. Regions evaluates securities in a loss position for other-than-temporary impairment, considering such
factors as the length of time and the extent to which the market value has been below cost, the credit standing of
the issuer, and Regions’ ability and intent to hold the security until its market value recovers. During 2008 and
2007, Regions recognized a write-down of securities within the General Banking/Treasury segment of
approximately $28.3 million and $7.2 million, respectively, representing other-than-temporary impairment,
related primarily to equity securities and retained interests on beneficial interests. Net unrealized gains and losses
in the securities available for sale portfolio are included in stockholders’ equity as accumulated other
comprehensive income or loss, net of tax.
In January 2009, Regions sold approximately $656 million in available for sale U.S Treasury securities and
recognized a gain of approximately $52.1 million. The proceeds were reinvested in U.S. government agency
mortgage-backed securities classified as available for sale.
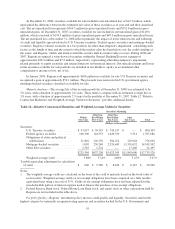
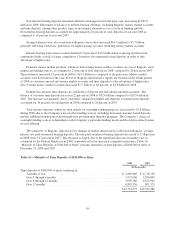
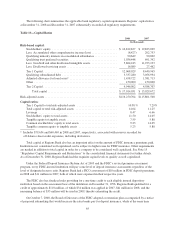
Maturity Analysis—The average life of the securities portfolio at December 31, 2008 was estimated to be
3.0 years, with a duration of approximately 2.6 years. These metrics compare with an estimated average life of
3.8 years, with a duration of approximately 2.9 years for the portfolio at December 31, 2007. Table 12 “Relative
Contractual Maturities and Weighted-Average Yields for Securities” provides additional details.
Table 12—Relative Contractual Maturities and Weighted-Average Yields for Securities
Securities Maturing
Within
One Year
After One
But Within
Five Years
After Five
But Within
Ten Years
After
Ten Years Total
(Dollars in thousands)
Securities:
U.S. Treasury securities ............. $ 97,637 $ 59,519 $ 743,147 $ — $ 900,303
Federal agency securities ............ 106,300 144,333 1,449,539 5,514 1,705,686
Obligations of states and political
subdivisions ..................... 21,862 201,592 304,212 229,028 756,694
Mortgage-backed securities .......... 1,005 230,240 2,526,445 11,591,652 14,349,342
Other debt securities ................ 2,565 1,524 — 17,406 21,495
$229,369 $637,208 $5,023,343 $11,843,600 $17,733,520
Weighted-average yield ............. 3.88% 5.34% 4.60% 5.25% 5.07%
Taxable-equivalent adjustment for calculation
of yield ............................ $ 606 $ 5,586 $ 8,430 $ 6,347 $ 20,969
Notes:
1. The weighted-average yields are calculated on the basis of the yield to maturity based on the book value of
each security. Weighted-average yields on tax-exempt obligations have been computed on a fully taxable-
equivalent basis using a tax rate of 35%. Yields on tax-exempt obligations have not been adjusted for the
non-deductible portion of interest expense used to finance the purchase of tax-exempt obligations.
2. Federal Reserve Bank stock, Federal Home Loan Bank stock, and equity stock of other corporations held by
Regions are not included in the table above.
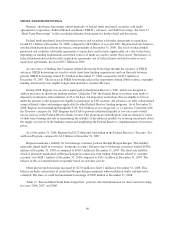
Portfolio Quality—Regions’ investment policy stresses credit quality and liquidity. Securities rated in the
highest category by nationally recognized rating agencies and securities backed by the U.S. Government and
55