Regions Bank 2008 Annual Report Download - page 125
Download and view the complete annual report
Please find page 125 of the 2008 Regions Bank annual report below. You can navigate through the pages in the report by either clicking on the pages listed below, or by using the keyword search tool below to find specific information within the annual report.-
 1
1 -
2
-
3
-
4
-
5
-
6
-
7
-
8
-
9
-
10
-
11
-
12
-
13
-
14
-
15
-
16
-
17
-
18
-
19
-
20
-
21
-
22
-
23
-
24
-
25
-
26
-
27
-
28
-
29
-
30
-
31
-
32
-
33
-
34
-
35
-
36
-
37
-
38
-
39
-
40
-
41
-
42
-
43
-
44
-
45
-
46
-
47
-
48
-
49
-
50
-
51
-
52
-
53
-
54
-
55
-
56
-
57
-
58
-
59
-
60
-
61
-
62
-
63
-
64
-
65
-
66
-
67
-
68
-
69
-
70
-
71
-
72
-
73
-
74
-
75
-
76
-
77
-
78
-
79
-
80
-
81
-
82
-
83
-
84
-
85
-
86
-
87
-
88
-
89
-
90
-
91
-
92
-
93
-
94
-
95
-
96
-
97
-
98
-
99
-
100
-
101
-
102
-
103
-
104
-
105
-
106
-
107
-
108
-
109
-
110
-
111
-
112
-
113
-
114
-
 115
115 -
 116
116 -
 117
117 -
 118
118 -
 119
119 -
 120
120 -
 121
121 -
 122
122 -
 123
123 -
 124
124 -
 125
125 -
 126
126 -
 127
127 -
 128
128 -
 129
129 -
 130
130 -
 131
131 -
 132
132 -
 133
133 -
 134
134 -
 135
135 -
136
-
137
-
138
-
139
-
140
-
141
-
142
-
143
-
144
-
145
-
146
-
147
-
148
-
149
-
150
-
151
-
152
-
153
-
154
-
155
-
156
-
157
-
158
-
159
-
160
-
161
-
162
-
163
-
164
-
165
-
166
-
167
-
168
-
169
-
170
-
171
-
172
-
173
-
174
-
175
-
176
-
177
-
178
-
179
-
180
-
181
-
182
-
183
-
184
 |
 |

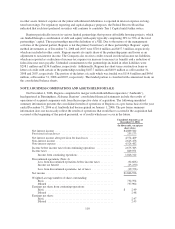
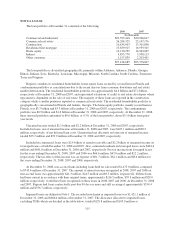
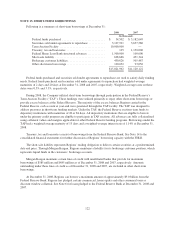
NOTE 6. LOANS
The loan portfolio at December 31 consisted of the following:
2008 2007
(In thousands)
Commercial and industrial ................................... $23,595,418 $20,906,617
Commercial real estate ...................................... 26,208,325 23,107,176
Construction .............................................. 10,634,063 13,301,898
Residential first mortgage .................................... 15,839,015 16,959,545
Home equity .............................................. 16,130,255 14,962,007
Indirect .................................................. 3,853,770 3,938,113
Other consumer ............................................ 1,157,839 2,203,491
$97,418,685 $95,378,847
The loan portfolio is diversified geographically, primarily within Alabama, Arkansas, Florida, Georgia,
Illinois, Indiana, Iowa, Kentucky, Louisiana, Mississippi, Missouri, North Carolina, South Carolina, Tennessee,
Texas and Virginia.
Regions considers its residential homebuilder, home equity loans secured by second liens in Florida and
condominium portfolios as concentrations due to the recent stresses from economic downturns and real estate
market deterioration. The residential homebuilder portfolio was approximately $4.4 billion and $7.2 billion,
respectively at December 31, 2008 and 2007, and represented extensions of credit to real estate developers where
repayment is dependent on the sale of real estate. The majority of these loans are reported in the construction
category while a smaller portion is reported as commercial real estate. The residential homebuilder portfolio is
geographically concentrated in Florida and Atlanta, Georgia. The home equity portfolio, mainly second liens in
Florida, was $3.7 billion and $3.3 billion at December 31, 2008 and 2007, respectively. The condominium
portfolio was $0.9 billion and $1.6 billion at December 31, 2008 and 2007, respectively. At December 31, 2008,
these stressed portfolios amounted to $9.0 billion, or 9.3% of the loan portfolio, down $3.1 billion from prior-
year levels.
Unearned income totaled $2.1 billion and $2.2 billion at December 31, 2008 and 2007, respectively.
Included in loans, net of unearned income at December 31, 2008 and 2007, were $107.1 million and $98.2
million, respectively, of net deferred loan costs. Unamortized net discounts on loans net of unearned income
totaled $25.7 million and $99.9 million at December 31, 2008 and 2007, respectively.
Included in commercial loans were $2.4 billion of rentals receivable and $2.2 billion of unearned income on
leveraged leases at both December 31, 2008 and 2007. Also, estimated residuals on leveraged leases were $481.4
million and $481.8 million at December 31, 2008 and 2007, respectively. Pre-tax income from leveraged leases
for the years ending December 31, 2008, 2007 and 2006 was $66.6 million, $67.0 million and $12.2 million,
respectively. The tax effect of this income was an expense of $61.7 million, $62.1 million and $8.6 million for
the years ending December 31, 2008, 2007 and 2006, respectively.
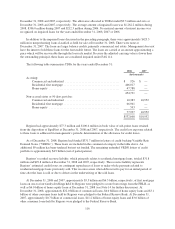
At December 31, 2008, non-accrual loans including loans held for sale totaled $1,475.0 million, compared
to $743.6 million at December 31, 2007. The amount of interest income recognized in 2008, 2007 and 2006 on
non-accrual loans was approximately $41.3 million, $24.5 million and $9.5 million, respectively. If these loans
had been current in accordance with their original terms, approximately $116.5 million, $39.9 million and $29.0
million, respectively, would have been recognized on these loans in 2008, 2007 and 2006. At December 31, 2008
and 2007, Regions had loans contractually past due 90 days or more and still accruing of approximately $554.4
million and $356.7 million, respectively.
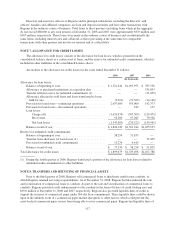
Impaired loans are defined in Note 1. The recorded investment in impaired loans was $1,421.1 million at
December 31, 2008 and $660.4 million at December 31, 2007. The allowance allocated to impaired loans,
excluding TDRs which are detailed in the table below, totaled $129.8 million and $103.9 million at
115