Regions Bank 2008 Annual Report Download - page 130
Download and view the complete annual report
Please find page 130 of the 2008 Regions Bank annual report below. You can navigate through the pages in the report by either clicking on the pages listed below, or by using the keyword search tool below to find specific information within the annual report.-
 1
1 -
2
-
3
-
4
-
5
-
6
-
7
-
8
-
9
-
10
-
11
-
12
-
13
-
14
-
15
-
16
-
17
-
18
-
19
-
20
-
21
-
22
-
23
-
24
-
25
-
26
-
27
-
28
-
29
-
30
-
31
-
32
-
33
-
34
-
35
-
36
-
37
-
38
-
39
-
40
-
41
-
42
-
43
-
44
-
45
-
46
-
47
-
48
-
49
-
50
-
51
-
52
-
53
-
54
-
55
-
56
-
57
-
58
-
59
-
60
-
61
-
62
-
63
-
64
-
65
-
66
-
67
-
68
-
69
-
70
-
71
-
72
-
73
-
74
-
75
-
76
-
77
-
78
-
79
-
80
-
81
-
82
-
83
-
84
-
85
-
86
-
87
-
88
-
89
-
90
-
91
-
92
-
93
-
94
-
95
-
96
-
97
-
98
-
99
-
100
-
101
-
102
-
103
-
104
-
105
-
106
-
107
-
108
-
109
-
110
-
111
-
112
-
113
-
114
-
115
-
116
-
117
-
118
-
119
-
 120
120 -
 121
121 -
 122
122 -
 123
123 -
 124
124 -
 125
125 -
 126
126 -
 127
127 -
 128
128 -
 129
129 -
 130
130 -
 131
131 -
 132
132 -
 133
133 -
 134
134 -
 135
135 -
 136
136 -
 137
137 -
 138
138 -
 139
139 -
 140
140 -
141
-
142
-
143
-
144
-
145
-
146
-
147
-
148
-
149
-
150
-
151
-
152
-
153
-
154
-
155
-
156
-
157
-
158
-
159
-
160
-
161
-
162
-
163
-
164
-
165
-
166
-
167
-
168
-
169
-
170
-
171
-
172
-
173
-
174
-
175
-
176
-
177
-
178
-
179
-
180
-
181
-
182
-
183
-
184
 |
 |

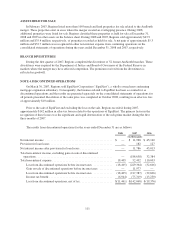
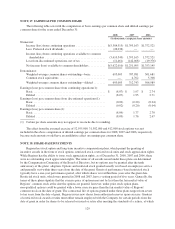
In the fourth quarter of 2008, Regions’ Step One analysis indicated potential impairment for the General
Banking/Treasury reporting unit. Therefore, Step Two was performed and resulted in the Company recording a
goodwill impairment charge of $6.0 billion in the General Banking/Treasury reporting unit. The primary cause of
the goodwill impairment in the General Banking/Treasury reporting unit was the continued and significant
decline in the estimated fair value of the unit. This was evidenced by rapid deterioration in credit costs, continued
compression of the net interest margin, costs of preferred stock investment by the U.S. Treasury and continued
declines in the Company’s overall market capitalization compounded by investor anxiety caused by the financial
crises affecting the U.S. banking system during the fourth quarter of 2008.
The Investment Banking/Brokerage/Trust and Insurance reporting units’ Step One impairment tests
indicated that the fair values of those reporting units were greater than the carrying values (including goodwill)
during 2008; therefore, Step Two was not performed by the Company for these units.
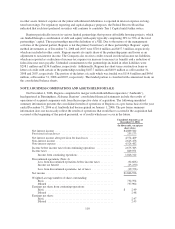
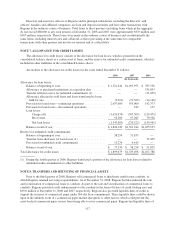
OTHER INTANGIBLES
A summary of core deposit intangible assets at December 31 is presented as follows:
2008 2007
(In thousands)
Balance at beginning of year ............................. $715,196 $ 941,880
Amounts related to business combinations .................. 2,336 (71,338)
Accumulated amortization, beginning of year ............ (293,906) (138,560)
Amortization ...................................... (134,139) (155,346)
Accumulated amortization, end of year ................. (428,045) (293,906)
Balance at end of year .................................. $583,393 $ 715,196
Regions’ core deposit intangible assets are being amortized on an accelerated basis over a ten-year period.
Other identifiable intangible assets are reviewed at least annually, usually in the fourth quarter, for events or
circumstances that could impact the recoverability of the intangible asset. These events could include loss of core
deposits, increased competition or adverse changes in the economy. To the extent other identifiable intangible
assets are deemed unrecoverable, impairment losses are recorded in other non-interest expense to reduce the
carrying amount.
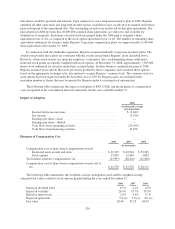
Regions has other intangible assets totaling $55.0 million and $44.6 million at December 31, 2008 and
2007, respectively. These other intangible assets resulted from customer relationships and employment
agreements related to various acquisitions and are being amortized primarily on an accelerated basis over a
period ranging from two to twelve years. In 2008 and 2007, Regions’ amortization of other intangibles was $15.6
million and $5.9 million, respectively. Regions noted no indicators of impairment for all other identifiable
intangible assets.
The aggregate amount of amortization expense for core deposit intangibles and other intangibles is
estimated to be $133.3 million in 2009, $120.0 million in 2010, $101.6 million in 2011, $88.3 million in 2012,
and $74.9 million in 2013.
120