Regions Bank 2008 Annual Report Download - page 92
Download and view the complete annual report
Please find page 92 of the 2008 Regions Bank annual report below. You can navigate through the pages in the report by either clicking on the pages listed below, or by using the keyword search tool below to find specific information within the annual report.-
 1
1 -
2
-
3
-
4
-
5
-
6
-
7
-
8
-
9
-
10
-
11
-
12
-
13
-
14
-
15
-
16
-
17
-
18
-
19
-
20
-
21
-
22
-
23
-
24
-
25
-
26
-
27
-
28
-
29
-
30
-
31
-
32
-
33
-
34
-
35
-
36
-
37
-
38
-
39
-
40
-
41
-
42
-
43
-
44
-
45
-
46
-
47
-
48
-
49
-
50
-
51
-
52
-
53
-
54
-
55
-
56
-
57
-
58
-
59
-
60
-
61
-
62
-
63
-
64
-
65
-
66
-
67
-
68
-
69
-
70
-
71
-
72
-
73
-
74
-
75
-
76
-
77
-
78
-
79
-
80
-
81
-
 82
82 -
 83
83 -
 84
84 -
 85
85 -
 86
86 -
 87
87 -
 88
88 -
 89
89 -
 90
90 -
 91
91 -
 92
92 -
 93
93 -
 94
94 -
 95
95 -
 96
96 -
 97
97 -
 98
98 -
 99
99 -
 100
100 -
 101
101 -
 102
102 -
103
-
104
-
105
-
106
-
107
-
108
-
109
-
110
-
111
-
112
-
113
-
114
-
115
-
116
-
117
-
118
-
119
-
120
-
121
-
122
-
123
-
124
-
125
-
126
-
127
-
128
-
129
-
130
-
131
-
132
-
133
-
134
-
135
-
136
-
137
-
138
-
139
-
140
-
141
-
142
-
143
-
144
-
145
-
146
-
147
-
148
-
149
-
150
-
151
-
152
-
153
-
154
-
155
-
156
-
157
-
158
-
159
-
160
-
161
-
162
-
163
-
164
-
165
-
166
-
167
-
168
-
169
-
170
-
171
-
172
-
173
-
174
-
175
-
176
-
177
-
178
-
179
-
180
-
181
-
182
-
183
-
184
 |
 |

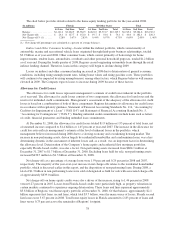
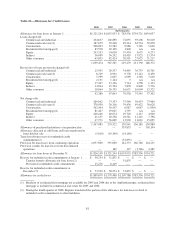
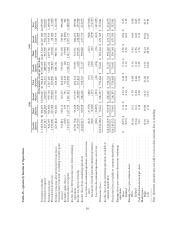
2008 2007 2006 2005 2004
(In thousands)
Loans, net of unearned income, outstanding
at end of period ..................... $97,418,685 $95,378,847 $94,550,602 $58,404,913 $57,526,954
Average loans, net of unearned income
outstanding for the period ............. $97,601,272 $94,372,061 $64,765,653 $58,002,167 $44,667,472
Ratios:
Allowance for loan losses at end of
period to loans, net of unearned
income ........................ 1.87% 1.39% 1.12% 1.34% 1.31%
Allowance for credit losses at end of
period to loans, net of unearned
income ........................ 1.95 1.45 1.17 1.34 1.31
Allowance for loan losses at end of
period to non-performing loans,
excluding loans held for sale ....... 1.74 1.78 3.45 2.29 1.94
Allowance for credit losses at end of
period to non-performing loans,
excluding loans held for sale ....... 1.81 1.86 3.61 2.29 1.94
Net charge-offs as percentage of:
Average loans, net of unearned
income .................... 1.59 0.29 0.22 0.23 0.29
Provision for loan losses ........ 75.2 48.7 98.2 82.5 101.9
Allowance for credit losses ...... 81.4 19.6 12.6 17.4 17.4
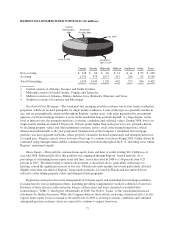
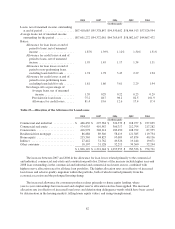
Table 23—Allocation of the Allowance for Loan Losses
2008 2007 2006 2005 2004
(In thousands)
Commercial and industrial .............. $ 466,430 $ 295,384 $ 324,539 $ 218,957 $ 237,699
Commercial real estate ................. 574,935 410,587 306,717 212,794 217,282
Construction ......................... 416,978 348,214 189,450 108,722 87,955
Residential first mortgage ............... 86,888 89,346 58,419 121,385 119,734
Home equity ......................... 235,369 94,823 95,089 67,874 40,136
Indirect ............................. 27,442 51,762 49,526 19,444 19,671
Other consumer ....................... 18,107 31,128 32,213 34,360 32,244
$ 1,826,149 $ 1,321,244 $ 1,055,953 $ 783,536 $ 754,721
The increase between 2007 and 2008 in the allowance for loan losses related primarily to the commercial
and industrial, commercial real estate and construction portfolios. Drivers of the increase include higher year-end
2008 loan outstandings in the commercial and industrial and commercial real estate sectors, combined with
higher reserve allocation rates for all three loan portfolios. The higher allocation rates are reflective of increased
loan losses and adverse quality migration within the portfolio, both of which resulted primarily from the
economic recession and the prolonged housing slump.
The increased allowance for consumer products relates primarily to home equity lending, where
year-to-year outstandings have increased and a higher reserve allocation rate has been applied. The increased
allocation rate is reflective of increased loan losses and deteriorating delinquency trends which have been caused
by deterioration in the housing markets, falling home equity values, and rising unemployment.
82