Bank of America 2006 Annual Report Download - page 117
Download and view the complete annual report
Please find page 117 of the 2006 Bank of America annual report below. You can navigate through the pages in the report by either clicking on the pages listed below, or by using the keyword search tool below to find specific information within the annual report.-
 1
1 -
2
-
3
-
4
-
5
-
6
-
7
-
8
-
9
-
10
-
11
-
12
-
13
-
14
-
15
-
16
-
17
-
18
-
19
-
20
-
21
-
22
-
23
-
24
-
25
-
26
-
27
-
28
-
29
-
30
-
31
-
32
-
33
-
34
-
35
-
36
-
37
-
38
-
39
-
40
-
41
-
42
-
43
-
44
-
45
-
46
-
47
-
48
-
49
-
50
-
51
-
52
-
53
-
54
-
55
-
56
-
57
-
58
-
59
-
60
-
61
-
62
-
63
-
64
-
65
-
66
-
67
-
68
-
69
-
70
-
71
-
72
-
73
-
74
-
75
-
76
-
77
-
78
-
79
-
80
-
81
-
82
-
83
-
84
-
85
-
86
-
87
-
88
-
89
-
90
-
91
-
92
-
93
-
94
-
95
-
96
-
97
-
98
-
99
-
100
-
101
-
102
-
103
-
104
-
105
-
106
-
 107
107 -
 108
108 -
 109
109 -
 110
110 -
 111
111 -
 112
112 -
 113
113 -
 114
114 -
 115
115 -
 116
116 -
 117
117 -
 118
118 -
 119
119 -
 120
120 -
 121
121 -
 122
122 -
 123
123 -
 124
124 -
 125
125 -
 126
126 -
 127
127 -
128
-
129
-
130
-
131
-
132
-
133
-
134
-
135
-
136
-
137
-
138
-
139
-
140
-
141
-
142
-
143
-
144
-
145
-
146
-
147
-
148
-
149
-
150
-
151
-
152
-
153
-
154
-
155
 |
 |

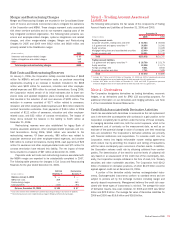
Fair Value and Cash Flow Hedges
The Corporation uses various types of interest rate and foreign currency
exchange rate derivative contracts to protect against changes in the fair
value of its assets and liabilities due to fluctuations in interest rates and
exchange rates (fair value hedges). The Corporation also uses these types
of contracts to protect against changes in the cash flows of its assets and
liabilities, and other forecasted transactions (cash flow hedges).
For cash flow hedges, gains and losses on derivative contracts
reclassified from Accumulated OCI to current period earnings are included
in the line item in the Consolidated Statement of Income in which the
hedged item is recorded and in the same period the hedged item affects
earnings. During the next 12 months, net losses on derivative instruments
included in Accumulated OCI of approximately $1.0 billion ($658 million
after-tax) are expected to be reclassified into earnings. These net losses
reclassified into earnings are expected to decrease income or increase
expense on the respective hedged items.
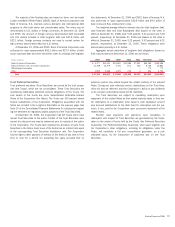
The following table summarizes certain information related to the
Corporation’s derivative hedges accounted for under SFAS 133 for 2006
and 2005:
(Dollars in millions) 2006 2005
Fair value hedges
Hedge ineffectiveness recognized in earnings
(1)
$23
$166
Net gain (loss) excluded from assessment of
effectiveness
(2)
—
(13)
Cash flow hedges
Hedge ineffectiveness recognized in earnings
(3)
18
(31)
Net investment hedges
Gains (losses) included in foreign currency translation
adjustments within Accumulated OCI
(4)
(475)
66
(1) Hedge ineffectiveness was recognized primarily within Net Interest Income and Mortgage Banking Income
in the Consolidated Statement of Income for 2006 and 2005, respectively.
(2) Net gain (loss) excluded from assessment of effectiveness was recorded primarily within Mortgage
Banking Income in the Consolidated Statement of Income for 2005.
(3) Hedge ineffectiveness was recognized primarily within Net Interest Income in the Consolidated Statement
of Income for 2006 and 2005.
(4) Amount for 2006 primarily represents net investment hedges of certain foreign subsidiaries acquired in
connection with the MBNA merger.
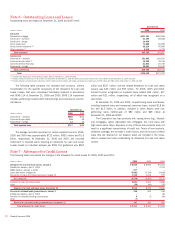
Note 5 – Securities
The amortized cost, gross unrealized gains and losses, and fair value of AFS debt and marketable equity securities at December 31, 2006 and 2005 were:
Available-for-sale securities
(Dollars in millions)
Amortized
Cost
Gross
Unrealized
Gains
Gross
Unrealized
Losses Fair Value
2006
U.S. Treasury securities and agency debentures
$ 697 $ – $ (9) $ 688
Mortgage-backed securities
161,693 4 (4,804) 156,893
Foreign securities
12,126 2 (78) 12,050
Other taxable securities
(1)
16,776 10 (134) 16,652
Total taxable securities
191,292 16 (5,025) 186,283
Tax-exempt securities
6,493 64 (34) 6,523
Total available-for-sale debt securities
$197,785 $ 80 $(5,059) $192,806
Available-for-sale marketable equity securities (2)
$ 2,799 $408 $ (10) $ 3,197
2005
U.S. Treasury securities and agency debentures $ 730 $ – $ (13) $ 717
Mortgage-backed securities 197,101 198 (5,268) 192,031
Foreign securities 10,944 1 (54) 10,891
Other taxable securities
(1)
13,198 126 (99) 13,225
Total taxable securities 221,973 325 (5,434) 216,864
Tax-exempt securities 4,693 31 (32) 4,692
Total available-for-sale debt securities $226,666 $356 $(5,466) $221,556
Available-for-sale marketable equity securities (2) $ 575 $305 $ (18) $ 862
(1) Includes corporate debt and asset-backed securities.
(2) Represents those AFS marketable equity securities that are recorded in Other Assets on the Consolidated Balance Sheet.
At December 31, 2006, the amortized cost and fair value of both
taxable and tax-exempt Held-to-maturity Securities was $40 million. At
December 31, 2005, the amortized cost and fair value of both taxable and
tax-exempt Held-to-maturity Securities was $47 million.
At December 31, 2006, accumulated net unrealized losses on AFS
debt and marketable equity securities included in Accumulated OCI were
$2.9 billion, net of the related income tax benefit of $1.7 billion. At
December 31, 2005, accumulated net unrealized losses on these secu-
rities were $3.0 billion, net of the related income tax benefit of $1.8 bil-
lion.
Bank of America 2006
115