Bank of America 2006 Annual Report Download - page 151
Download and view the complete annual report
Please find page 151 of the 2006 Bank of America annual report below. You can navigate through the pages in the report by either clicking on the pages listed below, or by using the keyword search tool below to find specific information within the annual report.-
 1
1 -
2
-
3
-
4
-
5
-
6
-
7
-
8
-
9
-
10
-
11
-
12
-
13
-
14
-
15
-
16
-
17
-
18
-
19
-
20
-
21
-
22
-
23
-
24
-
25
-
26
-
27
-
28
-
29
-
30
-
31
-
32
-
33
-
34
-
35
-
36
-
37
-
38
-
39
-
40
-
41
-
42
-
43
-
44
-
45
-
46
-
47
-
48
-
49
-
50
-
51
-
52
-
53
-
54
-
55
-
56
-
57
-
58
-
59
-
60
-
61
-
62
-
63
-
64
-
65
-
66
-
67
-
68
-
69
-
70
-
71
-
72
-
73
-
74
-
75
-
76
-
77
-
78
-
79
-
80
-
81
-
82
-
83
-
84
-
85
-
86
-
87
-
88
-
89
-
90
-
91
-
92
-
93
-
94
-
95
-
96
-
97
-
98
-
99
-
100
-
101
-
102
-
103
-
104
-
105
-
106
-
107
-
108
-
109
-
110
-
111
-
112
-
113
-
114
-
115
-
116
-
117
-
118
-
119
-
120
-
121
-
122
-
123
-
124
-
125
-
126
-
127
-
128
-
129
-
130
-
131
-
132
-
133
-
134
-
135
-
136
-
137
-
138
-
139
-
140
-
 141
141 -
 142
142 -
 143
143 -
 144
144 -
 145
145 -
 146
146 -
 147
147 -
 148
148 -
 149
149 -
 150
150 -
 151
151 -
 152
152 -
 153
153 -
 154
154 -
 155
155
 |
 |

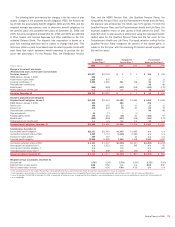
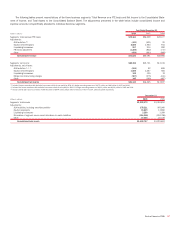
Condensed Statement of Cash Flows
Year Ended December 31
(Dollars in millions) 2006 2005 2004
Operating activities
Net income
$ 21,133
$ 16,465 $13,947
Reconciliation of net income to net cash provided by operating activities:
Equity in undistributed earnings of subsidiaries
(6,598)
(7,390) (6,739)
Other operating activities, net
2,159
(1,035) (1,487)
Net cash provided by operating activities
16,694
8,040 5,721
Investing activities
Net (purchases) sales of securities
(705)
403 (1,348)
Net payments from (to) subsidiaries
(13,673)
(3,145) 821
Other investing activities, net
(1,300)
(3,001) 3,348
Net cash provided by (used in) investing activities
(15,678)
(5,743) 2,821
Financing activities
Net increase (decrease) in commercial paper and other short-term borrowings
12,519
(292) 15,937
Proceeds from issuance of long-term debt
28,412
20,477 19,965
Retirement of long-term debt
(15,506)
(11,053) (9,220)
Proceeds from issuance of preferred stock
2,850
——
Redemption of preferred stock
(270)
——
Proceeds from issuance of common stock
3,117
2,846 3,712
Common stock repurchased
(14,359)
(5,765) (6,286)
Cash dividends paid
(9,661)
(7,683) (6,468)
Other financing activities, net
(2,799)
1,705 520
Net cash provided by financing activities
4,303
235 18,160
Net increase in cash held at bank subsidiaries
5,319
2,532 26,702
Cash held at bank subsidiaries at January 1
49,670
47,138 20,436
Cash held at bank subsidiaries at December 31
$ 54,989
$ 49,670 $47,138
Bank of America 2006
149