Bank of America 2006 Annual Report Download - page 52
Download and view the complete annual report
Please find page 52 of the 2006 Bank of America annual report below. You can navigate through the pages in the report by either clicking on the pages listed below, or by using the keyword search tool below to find specific information within the annual report.-
 1
1 -
2
-
3
-
4
-
5
-
6
-
7
-
8
-
9
-
10
-
11
-
12
-
13
-
14
-
15
-
16
-
17
-
18
-
19
-
20
-
21
-
22
-
23
-
24
-
25
-
26
-
27
-
28
-
29
-
30
-
31
-
32
-
33
-
34
-
35
-
36
-
37
-
38
-
39
-
40
-
41
-
 42
42 -
 43
43 -
 44
44 -
 45
45 -
 46
46 -
 47
47 -
 48
48 -
 49
49 -
 50
50 -
 51
51 -
 52
52 -
 53
53 -
 54
54 -
 55
55 -
 56
56 -
 57
57 -
 58
58 -
 59
59 -
 60
60 -
 61
61 -
 62
62 -
63
-
64
-
65
-
66
-
67
-
68
-
69
-
70
-
71
-
72
-
73
-
74
-
75
-
76
-
77
-
78
-
79
-
80
-
81
-
82
-
83
-
84
-
85
-
86
-
87
-
88
-
89
-
90
-
91
-
92
-
93
-
94
-
95
-
96
-
97
-
98
-
99
-
100
-
101
-
102
-
103
-
104
-
105
-
106
-
107
-
108
-
109
-
110
-
111
-
112
-
113
-
114
-
115
-
116
-
117
-
118
-
119
-
120
-
121
-
122
-
123
-
124
-
125
-
126
-
127
-
128
-
129
-
130
-
131
-
132
-
133
-
134
-
135
-
136
-
137
-
138
-
139
-
140
-
141
-
142
-
143
-
144
-
145
-
146
-
147
-
148
-
149
-
150
-
151
-
152
-
153
-
154
-
155
 |
 |

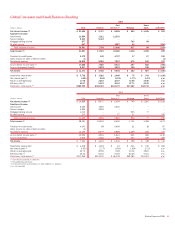
Global Corporate and Investment Banking
2006
(Dollars in millions) Total
Business
Lending
Capital
Markets and
Advisory
Services
Treasury
Services
ALM/
Other
Net interest income (1)
$ 10,693 $ 4,605 $ 1,651 $ 3,880 $ 557
Noninterest income
Service charges
2,777 501 120 1,995 161
Investment and brokerage services
1,027 15 867 33 112
Investment banking income
2,477
–
2,476
–
1
Trading account profits
3,028 54 2,748 48 178
All other income
2,689 507 338 734 1,110
Total noninterest income
11,998 1,077 6,549 2,810 1,562
Total revenue (1)
22,691 5,682 8,200 6,690 2,119
Provision for credit losses
(6) 3 14 (2) (21)
Gains on sales of debt securities
53 13 22 – 18
Noninterest expense
11,998 2,153 5,524 3,248 1,073
Income before income taxes
(1)
10,752 3,539 2,684 3,444 1,085
Income tax expense
3,960 1,310 993 1,274 383
Net income
$ 6,792 $ 2,229 $ 1,691 $ 2,170 $ 702
Shareholder value added
$ 2,349 $ 623 $ 517 $ 1,431 $ (222)
Net interest yield
(1)
1.71% 2.00% n/m 2.85% n/m
Return on average equity
16.21 14.23 15.76% 30.76 n/m
Efficiency ratio
(1)
52.87 37.89 67.36 48.55 n/m
Period end – total assets
(2)
$689,248 $246,414 $384,151 $166,503 n/m
2005
(Dollars in millions) Total
Business
Lending
Capital
Markets and
Advisory
Services
Treasury
Services
ALM/
Other
Net interest income (1) $ 11,156 $ 4,825 $ 1,938 $ 3,375 $1,018
Noninterest income
Service charges 2,618 474 111 1,866 167
Investment and brokerage services 1,046 17 876 28 125
Investment banking income 1,892 – 1,891 – 1
Trading account profits 1,770 (28) 1,618 63 117
All other income 2,118 769 329 676 344
Total noninterest income 9,444 1,232 4,825 2,633 754
Total revenue (1) 20,600 6,057 6,763 6,008 1,772
Provision for credit losses (291) 67 (27) (4) (327)
Gains on sales of debt securities 263 62 55 – 146
Noninterest expense 11,133 2,010 4,754 3,149 1,220
Income before income taxes
(1)
10,021 4,042 2,091 2,863 1,025
Income tax expense 3,637 1,448 745 1,030 414
Net income $ 6,384 $ 2,594 $ 1,346 $ 1,833 $ 611
Shareholder value added $ 1,966 $ 1,031 $ 265 $ 1,128 $ (458)
Net interest yield
(1)
2.03% 2.36% n/m 2.37% n/m
Return on average equity 15.28 16.92 13.61% 27.06 n/m
Efficiency ratio
(1)
54.04 33.18 70.30 52.41 n/m
Period end – total assets
(2)
$633,362 $227,523 $338,190 $170,601 n/m
(1) Fully taxable-equivalent basis
(2) Total Assets include asset allocations to match liabilities (i.e., deposits).
n/m = not meaningful
50
Bank of America 2006