Bank of America 2006 Annual Report Download - page 148
Download and view the complete annual report
Please find page 148 of the 2006 Bank of America annual report below. You can navigate through the pages in the report by either clicking on the pages listed below, or by using the keyword search tool below to find specific information within the annual report.-
 1
1 -
2
-
3
-
4
-
5
-
6
-
7
-
8
-
9
-
10
-
11
-
12
-
13
-
14
-
15
-
16
-
17
-
18
-
19
-
20
-
21
-
22
-
23
-
24
-
25
-
26
-
27
-
28
-
29
-
30
-
31
-
32
-
33
-
34
-
35
-
36
-
37
-
38
-
39
-
40
-
41
-
42
-
43
-
44
-
45
-
46
-
47
-
48
-
49
-
50
-
51
-
52
-
53
-
54
-
55
-
56
-
57
-
58
-
59
-
60
-
61
-
62
-
63
-
64
-
65
-
66
-
67
-
68
-
69
-
70
-
71
-
72
-
73
-
74
-
75
-
76
-
77
-
78
-
79
-
80
-
81
-
82
-
83
-
84
-
85
-
86
-
87
-
88
-
89
-
90
-
91
-
92
-
93
-
94
-
95
-
96
-
97
-
98
-
99
-
100
-
101
-
102
-
103
-
104
-
105
-
106
-
107
-
108
-
109
-
110
-
111
-
112
-
113
-
114
-
115
-
116
-
117
-
118
-
119
-
120
-
121
-
122
-
123
-
124
-
125
-
126
-
127
-
128
-
129
-
130
-
131
-
132
-
133
-
134
-
135
-
136
-
137
-
 138
138 -
 139
139 -
 140
140 -
 141
141 -
 142
142 -
 143
143 -
 144
144 -
 145
145 -
 146
146 -
 147
147 -
 148
148 -
 149
149 -
 150
150 -
 151
151 -
 152
152 -
 153
153 -
 154
154 -
 155
155
 |
 |

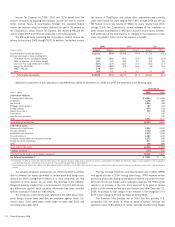
All Other consists of equity investment activities including Principal
Investing, Corporate Investments and Strategic Investments, the residual
impact of the allowance for credit losses and the cost allocation proc-
esses, Merger and Restructuring Charges, intersegment eliminations, and
the results of certain consumer finance and commercial lending busi-
nesses that are being liquidated. All Other also includes certain amounts
associated with ALM activities, including the residual impact of funds
transfer pricing allocation methodologies, amounts associated with the
change in the value of derivatives used as economic hedges of interest
rate and foreign exchange rate fluctuations that do not qualify for SFAS
133 hedge accounting treatment, certain gains or losses on sales of
whole mortgage loans, and Gains (Losses) on Sales of Debt Securities.
Total Revenue includes Net Interest Income on a FTE basis and
Noninterest Income. The adjustment of Net Interest Income to a FTE basis
results in a corresponding increase in Income Tax Expense. The Net Inter-
est Income of the businesses includes the results of a funds transfer pric-
ing process that matches assets and liabilities with similar interest rate
sensitivity and maturity characteristics. Net Interest Income of the busi-
ness segments also includes an allocation of Net Interest Income gen-
erated by the Corporation’s ALM activities.
Certain expenses not directly attributable to a specific business
segment are allocated to the segments based on pre-determined means.
The most significant of these expenses include data processing costs,
item processing costs and certain centralized or shared functions. Data
processing costs are allocated to the segments based on equipment
usage. Item processing costs are allocated to the segments based on the
volume of items processed for each segment. The costs of certain central-
ized or shared functions are allocated based on methodologies which
reflect utilization.
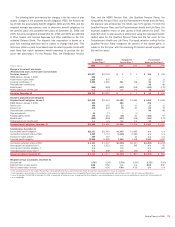
The following table presents Total Revenue on a FTE basis and Net
Income in 2006, 2005 and 2004, and Total Assets at December 31,
2006 and 2005 for each business segment, as well as All Other.
Business Segments
At and for the Year Ended December 31
Total Corporation
Global Consumer and
Small Business Banking
(1, 2)
(Dollars in millions) 2006 2005 2004 2006 2005 2004
Net interest income (FTE basis)
$ 35,815
$ 31,569 $28,677
$ 21,100
$ 16,898 $15,767
Noninterest income
38,432
25,354 21,005
20,591
11,425 8,958
Total revenue (FTE basis)
74,247
56,923 49,682
41,691
28,323 24,725
Provision for credit losses
5,010
4,014 2,769
5,172
4,243 3,331
Gains (losses) on sales of debt securities
(443)
1,084 1,724
(1)
(2) 117
Amortization of intangibles
1,755
809 664
1,511
551 441
Other noninterest expense
33,842
27,872 26,348
17,319
12,573 12,003
Income before income taxes
33,197
25,312 21,625
17,688
10,954 9,067
Income tax expense
12,064
8,847 7,678
6,517
3,933 3,300
Net income
$ 21,133
$ 16,465 $13,947
$ 11,171
$ 7,021 $ 5,767
Period-end total assets
$1,459,737
$1,291,803
$382,392
$331,259
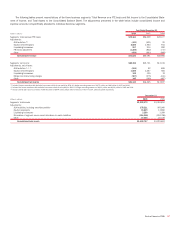
Global Corporate
and Investment Banking
(1)
Global Wealth and
Investment Management
(1, 2)
(Dollars in millions) 2006 2005 2004 2006 2005 2004
Net interest income (FTE basis)
$ 10,693
$ 11,156 $10,670
$ 3,881
$ 3,820 $ 2,921
Noninterest income
11,998
9,444 7,982
3,898
3,496 3,079
Total revenue (FTE basis)
22,691
20,600 18,652
7,779
7,316 6,000
Provision for credit losses
(6)
(291) (886)
(40)
(7) (22)
Gains (losses) on sales of debt securities
53
263 (10)
—
——
Amortization of intangibles
164
174 152
76
79 66
Other noninterest expense
11,834
10,959 10,149
3,929
3,631 3,392
Income before income taxes
10,752
10,021 9,227 3,814 3,613 2,564
Income tax expense
3,960
3,637 3,311
1,411
1,297 932
Net income
$ 6,792
$ 6,384 $ 5,916
$ 2,403
$ 2,316 $ 1,632
Period-end total assets
$ 689,248
$ 633,362
$137,739
$129,232
All Other
(Dollars in millions) 2006 2005 2004
Net interest income (FTE basis)
$ 141
$ (305) $ (681)
Noninterest income
1,945
989 986
Total revenue (FTE basis)
2,086
684 305
Provision for credit losses
(116)
69 346
Gains (losses) on sales of debt securities
(495)
823 1,617
Amortization of intangibles
4
55
Other noninterest expense
760
709 804
Income before income taxes
943
724 767
Income tax expense (benefit)
176
(20) 135
Net income
$ 767
$ 744 $ 632
Period-end total assets
$ 250,358
$ 197,950
(1) There were no material intersegment revenues among the segments.
(2) Total Assets include asset allocations to match liabilities (i.e., deposits).
146
Bank of America 2006