Bank of America 2006 Annual Report Download - page 143
Download and view the complete annual report
Please find page 143 of the 2006 Bank of America annual report below. You can navigate through the pages in the report by either clicking on the pages listed below, or by using the keyword search tool below to find specific information within the annual report.-
 1
1 -
2
-
3
-
4
-
5
-
6
-
7
-
8
-
9
-
10
-
11
-
12
-
13
-
14
-
15
-
16
-
17
-
18
-
19
-
20
-
21
-
22
-
23
-
24
-
25
-
26
-
27
-
28
-
29
-
30
-
31
-
32
-
33
-
34
-
35
-
36
-
37
-
38
-
39
-
40
-
41
-
42
-
43
-
44
-
45
-
46
-
47
-
48
-
49
-
50
-
51
-
52
-
53
-
54
-
55
-
56
-
57
-
58
-
59
-
60
-
61
-
62
-
63
-
64
-
65
-
66
-
67
-
68
-
69
-
70
-
71
-
72
-
73
-
74
-
75
-
76
-
77
-
78
-
79
-
80
-
81
-
82
-
83
-
84
-
85
-
86
-
87
-
88
-
89
-
90
-
91
-
92
-
93
-
94
-
95
-
96
-
97
-
98
-
99
-
100
-
101
-
102
-
103
-
104
-
105
-
106
-
107
-
108
-
109
-
110
-
111
-
112
-
113
-
114
-
115
-
116
-
117
-
118
-
119
-
120
-
121
-
122
-
123
-
124
-
125
-
126
-
127
-
128
-
129
-
130
-
131
-
132
-
 133
133 -
 134
134 -
 135
135 -
 136
136 -
 137
137 -
 138
138 -
 139
139 -
 140
140 -
 141
141 -
 142
142 -
 143
143 -
 144
144 -
 145
145 -
 146
146 -
 147
147 -
 148
148 -
 149
149 -
 150
150 -
 151
151 -
 152
152 -
 153
153 -
154
-
155
 |
 |

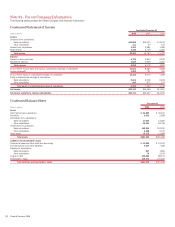
exposure related to participants who selected to receive an earnings
measure based on the return performance of common stock of the Corpo-
ration. No plan assets are expected to be returned to the Corporation
during 2007.
The Expected Return on Asset Assumption (EROA assumption) was
developed through analysis of historical market returns, historical asset
class volatility and correlations, current market conditions, anticipated
future asset allocations, the funds’ past experience, and expectations on
potential future market returns. The EROA assumption represents a long-
term average view of the performance of the Qualified Pension Plans and
Postretirement Health and Life Plan assets, a return that may or may not
be achieved during any one calendar year. In a simplistic analysis of the
EROA assumption, the building blocks used to arrive at the long-term
return assumption would include an implied return from equity securities
of 8.75 percent, debt securities of 5.75 percent, and real estate of 7.00
percent for all pension plans and postretirement health and life plans.
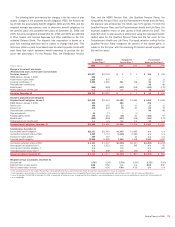
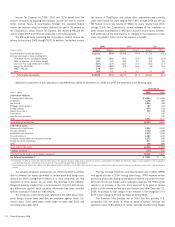
The Qualified Pension Plans’ and Postretirement Health and Life
Plans’ asset allocations at December 31, 2006 and 2005 and target allo-
cations for 2007 by asset category are presented in the following table.
Equity securities for the Qualified Pension Plans include common
stock of the Corporation in the amounts of $882 million (5.25 percent of
total plan assets) and $798 million (6.10 percent of total plan assets) at
December 31, 2006 and 2005.
The Bank of America and MBNA Postretirement Health and Life Plans
had no investment in the common stock of the Corporation at
December 31, 2006 or 2005. The FleetBoston Postretirement Health and
Life Plans included common stock of the Corporation in the amount of
$0.4 million (0.46 percent of total plan assets) and $0.3 million (0.27
percent of total plan assets) at December 31, 2006 and December 31,
2005, respectively.
Qualified
Pension Plans
Postretirement
Health and Life Plans
2007
Target
Allocation
Percentage of
Plan Assets at
December 31 2007
Target
Allocation
Percentage of
Plan Assets at
December 31
Asset Category 2006 2005 2006 2005
Equity securities 65 – 80%
68%
71% 50 – 70%
61%
57%
Debt securities 20 – 35
30
27 30 – 50
36
41
Real estate 0–5
2
20–5
3
2
Total
100%
100%
100%
100%
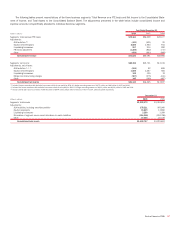
Projected Benefit Payments
Benefit payments projected to be made from the Qualified Pension Plans, the Nonqualified Pension Plans and the Postretirement Health and Life Plans are
as follows:
Qualified
Pension Plans
(1)
Nonqualified
Pension Plans
(2)
Postretirement Health and Life Plans
(Dollars in millions) Net Payments
(3)
Medicare Subsidy
2007 $1,007 $ 97 $135 $(12)
2008 1,022 101 135 (12)
2009 1,026 104 137 (12)
2010 1,035 103 138 (12)
2011 1,051 105 138 (12)
2012 – 2016 5,262 518 656 (58)
(1) Benefit payments expected to be made from the plans’ assets.
(2) Benefit payments expected to be made from the Corporation’s assets.
(3) Benefit payments (net of retiree contributions) expected to be made from a combination of the plans’ and the Corporation’s assets.
Defined Contribution Plans
The Corporation maintains qualified defined contribution retirement plans
and nonqualified defined contribution retirement plans. As a result of the
FleetBoston merger, beginning on April 1, 2004, the Corporation maintains
the defined contribution plans of former FleetBoston. As a result of the
MBNA merger on January 1, 2006, the Corporation also maintains the
defined contribution plans of former MBNA.
The Corporation contributed approximately $328 million, $274 mil-
lion and $267 million for 2006, 2005 and 2004, in cash and stock,
respectively. At December 31, 2006 and 2005, an aggregate of 99 million
shares and 106 million shares of the Corporation’s common stock were
held by the 401(k) Plans. During 2004, the Corporation converted the
ESOP Preferred Stock held by the Bank of America 401(k) Plan to common
stock so that there were no outstanding shares of preferred stock at
December 31, 2004 in the 401(k) Plans.
Under the terms of the Employee Stock Ownership Plan (ESOP) Pre-
ferred Stock provision for the Bank of America 401(k) Plan, payments to
the plan for dividends on the ESOP Preferred Stock were $4 million for
2004. Payments to the Bank of America 401(k) Plan and legacy Fleet-
Boston 401(k) Plan for dividends on Common Stock were $208 million,
$207 million and $181 million during 2006, 2005 and 2004, respectively.
Payments to the MBNA 401(k) Plan for dividends on the Corporation’s
common stock were $8 million in 2006.
Bank of America 2006
141