Bank of America 2006 Annual Report Download - page 54
Download and view the complete annual report
Please find page 54 of the 2006 Bank of America annual report below. You can navigate through the pages in the report by either clicking on the pages listed below, or by using the keyword search tool below to find specific information within the annual report.-
 1
1 -
2
-
3
-
4
-
5
-
6
-
7
-
8
-
9
-
10
-
11
-
12
-
13
-
14
-
15
-
16
-
17
-
18
-
19
-
20
-
21
-
22
-
23
-
24
-
25
-
26
-
27
-
28
-
29
-
30
-
31
-
32
-
33
-
34
-
35
-
36
-
37
-
38
-
39
-
40
-
41
-
42
-
43
-
 44
44 -
 45
45 -
 46
46 -
 47
47 -
 48
48 -
 49
49 -
 50
50 -
 51
51 -
 52
52 -
 53
53 -
 54
54 -
 55
55 -
 56
56 -
 57
57 -
 58
58 -
 59
59 -
 60
60 -
 61
61 -
 62
62 -
 63
63 -
 64
64 -
65
-
66
-
67
-
68
-
69
-
70
-
71
-
72
-
73
-
74
-
75
-
76
-
77
-
78
-
79
-
80
-
81
-
82
-
83
-
84
-
85
-
86
-
87
-
88
-
89
-
90
-
91
-
92
-
93
-
94
-
95
-
96
-
97
-
98
-
99
-
100
-
101
-
102
-
103
-
104
-
105
-
106
-
107
-
108
-
109
-
110
-
111
-
112
-
113
-
114
-
115
-
116
-
117
-
118
-
119
-
120
-
121
-
122
-
123
-
124
-
125
-
126
-
127
-
128
-
129
-
130
-
131
-
132
-
133
-
134
-
135
-
136
-
137
-
138
-
139
-
140
-
141
-
142
-
143
-
144
-
145
-
146
-
147
-
148
-
149
-
150
-
151
-
152
-
153
-
154
-
155
 |
 |

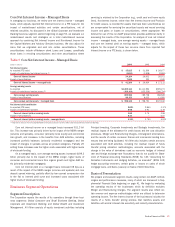
In support of these activities, the business may take positions in these
products and participate in market-making activities dealing in government
securities, equity and equity-linked securities, high-grade and high-yield
corporate debt securities, commercial paper, and mortgage-backed and
asset-backed securities. Underwriting debt and equity, securities research
and certain market-based activities are executed through Banc of America
Securities, LLC which is a primary dealer in the U.S. and several other
countries.
Capital Markets and Advisory Services market-based revenue
includes Net Interest Income, Noninterest Income, including equity
income, and Gains (Losses) on Sales of Debt Securities. We evaluate our
trading results and strategies based on market-based revenue. The follow-
ing table presents further detail regarding market-based revenue. Sales
and trading revenue is segregated into fixed income from liquid products
(primarily interest rate and commodity derivatives, foreign exchange con-
tracts and public finance), credit products (primarily investment and non-
investment grade corporate debt obligations and credit derivatives), and
structured products (primarily commercial mortgage-backed securities,
residential mortgage-backed securities, and collateralized debt
obligations), and equity income from equity-linked derivatives and cash
equity activity.
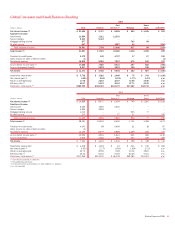
(Dollars in millions) 2006 2005
Investment banking income
Advisory fees
$ 338
$ 295
Debt underwriting
1,822
1,323
Equity underwriting
316
273
Total investment banking income
2,476
1,891
Sales and trading
Fixed income:
Liquid products
2,021
1,890
Credit products
825
634
Structured products
1,449
1,033
Total fixed income
4,295
3,557
Equity income
1,451
1,370
Total sales and trading (1)
5,746
4,927
Total Capital Markets and Advisory
Services market-based revenue (1)
$8,222
$6,818
(1) Includes Gains on Sales of Debt Securities of $22 million and $55 million for 2006 and 2005.
Net Income increased $345 million, or 26 percent, market-based
revenue increased $1.4 billion, or 21 percent, driven primarily by
increased sales and trading fixed income activity of $738 million, or 21
percent, due to a favorable market environment as well as benefits from
previous investments in personnel and trading infrastructure. Market-
based revenue also benefited from an increase in Investment Banking
Income of $585 million, or 31 percent, primarily driven by increased mar-
ket activity and continued strength in debt underwriting. Noninterest
Expense increased $770 million, or 16 percent, due to higher Personnel
expense, including performance-based incentive compensation, and Other
General Operating costs.
Treasury Services
Treasury Services provides integrated working capital management and
treasury solutions to clients worldwide through our network of proprietary
offices and special clearing arrangements. Our clients include multina-
tionals, middle-market companies, correspondent banks, commercial real
estate firms and governments. Our products and services include treasury
management, trade finance, foreign exchange, short-term credit facilities
and short-term investing options. Net Interest Income is derived from
interest and noninterest-bearing deposits, sweep investments, and other
liability management products. Deposit products provide a relatively stable
source of funding and liquidity. We earn net interest spread revenues from
investing this liquidity in earning assets through client facing lending activ-
ity and our ALM activities. The revenue is attributed to the deposit prod-
ucts using our funds transfer pricing process which takes into account the
interest rates and maturity characteristics of the deposits. Noninterest
Income is generated from payment and receipt products, merchant serv-
ices, wholesale card products, and trade services and is comprised primar-
ily of service charges which are net of market-based earnings credit rates
applied against noninterest-bearing deposits.
Net Income increased $337 million, or 18 percent, primarily due to
an increase in Net Interest Income, higher Service Charges and all other
income, partially offset by increased Noninterest Expense. Net Interest
Income from Treasury Services increased $505 million, or 15 percent,
driven primarily by wider spreads associated with higher short-term interest
rates as we effectively managed pricing in a rising interest rate environ-
ment. This was partially offset by the impact of a four percent decrease in
Treasury Services average deposit balances driven primarily by the slow-
down in the mortgage and title business reducing real estate escrow and
demand deposit balances. Service Charges and wholesale card products
increased seven percent and 14 percent benefiting from increased client
penetration and both market and product expansion. Noninterest Expense
increased $99 million, or three percent, due to higher Personnel expense
and Other General Operating costs.
ALM/Other
ALM/Other is comprised primarily of our Latin American operations in Bra-
zil, Chile, Argentina and Uruguay, and our commercial operations in Mex-
ico, as well as our Asia Commercial Banking business. These operations
primarily service indigenous and multinational corporations, small busi-
nesses and affluent consumers. Brazilian operations were included
through September 1, 2006, and the Asia Commercial Banking business
was included through December 29, 2006, the effective dates of the sales
of these operations. ALM/Other also includes an allocation of a portion of
the Corporation’s Net Interest Income from ALM activities. For more
information on our Latin American and Asian operations, see Foreign Port-
folio beginning on page 71.
Net Income increased $91 million, or 15 percent, which included the
$720 million gain (pre-tax) recorded on the sale of our Brazilian oper-
ations. The Corporation sold its operations in exchange for approximately
$1.9 billion in equity of Banco Itaú, Brazil’s second largest
nongovernment-owned banking company. The $1.9 billion equity invest-
ment in Banco Itaú is recorded in Other Assets in Strategic Investments.
For more information on our Strategic Investments, see All Other beginning
on page 55. The Corporation also completed the sale of its Asia Commer-
cial Banking business to CCB for cash resulting in a $165 million gain
(pre-tax) that was recorded in all other income. Partially offsetting these
increases was a decrease in Net Interest Income of $461 million driven by
the impact of ALM activities and the impact of the sale of our Brazilian
operations in the third quarter of 2006. The Provision for Credit losses
was negative $21 million, compared to negative $327 million in 2005.
The change in the Provision for Credit Losses was driven by the benefits
from the release of reserves in 2005 related to an improved risk profile in
Latin America. Gains on Sales of Debt Securities decreased $128 million
to $18 million in 2006. Noninterest expense decreased $147 million, or
12 percent, primarily driven by lower expenses after the sale of our Brazil-
ian operations in the third quarter of 2006.
52
Bank of America 2006