Bank of America 2006 Annual Report Download - page 74
Download and view the complete annual report
Please find page 74 of the 2006 Bank of America annual report below. You can navigate through the pages in the report by either clicking on the pages listed below, or by using the keyword search tool below to find specific information within the annual report.-
 1
1 -
2
-
3
-
4
-
5
-
6
-
7
-
8
-
9
-
10
-
11
-
12
-
13
-
14
-
15
-
16
-
17
-
18
-
19
-
20
-
21
-
22
-
23
-
24
-
25
-
26
-
27
-
28
-
29
-
30
-
31
-
32
-
33
-
34
-
35
-
36
-
37
-
38
-
39
-
40
-
41
-
42
-
43
-
44
-
45
-
46
-
47
-
48
-
49
-
50
-
51
-
52
-
53
-
54
-
55
-
56
-
57
-
58
-
59
-
60
-
61
-
62
-
63
-
 64
64 -
 65
65 -
 66
66 -
 67
67 -
 68
68 -
 69
69 -
 70
70 -
 71
71 -
 72
72 -
 73
73 -
 74
74 -
 75
75 -
 76
76 -
 77
77 -
 78
78 -
 79
79 -
 80
80 -
 81
81 -
 82
82 -
 83
83 -
 84
84 -
85
-
86
-
87
-
88
-
89
-
90
-
91
-
92
-
93
-
94
-
95
-
96
-
97
-
98
-
99
-
100
-
101
-
102
-
103
-
104
-
105
-
106
-
107
-
108
-
109
-
110
-
111
-
112
-
113
-
114
-
115
-
116
-
117
-
118
-
119
-
120
-
121
-
122
-
123
-
124
-
125
-
126
-
127
-
128
-
129
-
130
-
131
-
132
-
133
-
134
-
135
-
136
-
137
-
138
-
139
-
140
-
141
-
142
-
143
-
144
-
145
-
146
-
147
-
148
-
149
-
150
-
151
-
152
-
153
-
154
-
155
 |
 |

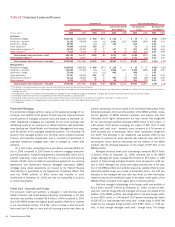
As presented in Table 25, foreign exposure to borrowers or counter-
parties in emerging markets increased $3.0 billion to $20.9 billion at
December 31, 2006, compared to $17.9 billion at December 31, 2005.
The increase was primarily due to higher sovereign and corporate secu-
rities trading exposures in Asia Pacific. Foreign exposure to borrowers or
counterparties in emerging markets represented 16 percent and 21 per-
cent of total foreign exposure at December 31, 2006 and 2005.
Table 25 Selected Emerging Markets (1)
(Dollars in millions)
Loans and
Leases,
and Loan
Commitments
Other
Financing
(2)
Derivative
Assets
(3)
Securities/
Other
Investments
(4)
Total
Cross-
border
Exposure
(5)
Local
Country
Exposure
Net of Local
Liabilities
(6)
Total Foreign
Exposure
December 31
2006
Increase/
(Decrease)
From
December 31
2005
Region/Country
Asia Pacific
China
$ 236
$ 48 $ 88 $ 3,193 $ 3,565 $ 49
$ 3,614
$ 210
South Korea
254
546 84 2,493 3,377 –
3,377
2,222
India
560
423 313 739 2,035 –
2,035
444
Singapore
226
9 116 521 872 –
872
402
Hong Kong
345
36 56 427 864 –
864
305
Taiwan
305
52 52 40 449 293
742
(176)
Other Asia Pacific
77
22 10 482 591 –
591
(4)
Total Asia Pacific
2,003
1,136 719 7,895 11,753 342
12,095
3,403
Latin America
Mexico
924
195 204 2,608 3,931 –
3,931
607
Brazil
153
84 26 1,986 2,249 402
2,651
(820)
Chile
221
13 – 9 243 83
326
(654)
Argentina
32
17 – 76 125 127
252
58
Other Latin America
108
131 10 18 267 15
282
(77)
Total Latin America
1,438
440 240 4,697 6,815 627
7,442
(886)
Middle East and Africa
484
261 140 231 1,116 –
1,116
414
Central and Eastern Europe
–
68 21 126 215 –
215
73
Total
$3,925
$1,905 $1,120 $12,949 $19,899 $969
$20,868
$3,004
(1) There is no generally accepted definition of emerging markets. The definition that we use includes all countries in Latin America excluding Cayman Islands and Bermuda; all countries in Asia Pacific excluding Japan, Australia
and New Zealand; all countries in Middle East and Africa; and all countries in Central and Eastern Europe excluding Greece.
(2) Includes acceptances, standby letters of credit, commercial letters of credit and formal guarantees.
(3) Derivative Assets are reported on a mark-to-market basis and have been reduced by the amount of cash collateral applied of $9 million and $80 million at December 31, 2006 and 2005. There are less than $1 million of
other marketable securities collateralizing derivative assets as of December 31, 2006. Derivative Assets were collateralized by $4 million of other marketable securities at December 31, 2005.
(4) Generally, cross-border resale agreements are presented based on the domicile of the counterparty because the counterparty has the legal obligation for repayment except where the underlying securities are U.S. Treasuries,
in which case the domicile is the U.S., and are therefore excluded from this presentation. For regulatory reporting under FFIEC guidelines, cross-border resale agreements are presented based on the domicile of the issuer of
the securities that are held as collateral.
(5) Cross-border exposure includes amounts payable to us by borrowers or counterparties with a country of residence other than the one in which the credit is booked, regardless of the currency in which the claim is denominated,
consistent with FFIEC reporting rules.
(6) Local country exposure includes amounts payable to us by borrowers with a country of residence in which the credit is booked, regardless of the currency in which the claim is denominated. Local funding or liabilities are
subtracted from local exposures as allowed by the FFIEC. Total amount of available local liabilities funding local country exposure at December 31, 2006 was $20.7 billion compared to $24.2 billion at December 31, 2005.
Local liabilities at December 31, 2006 in Asia Pacific and Latin America were $14.1 billion and $6.6 billion of which $6.6 billion were in Singapore, $3.6 billion in Hong Kong, $2.5 billion in Chile, $1.9 billion in Argentina, $1.4
billion in Mexico, $1.2 billion in South Korea, $829 million in India, $784 million in Uruguay, and $669 million in China. There were no other countries with available local liabilities funding local country exposure greater than
$500 million.
At December 31, 2006, 58 percent of the emerging markets
exposure was in Asia Pacific, compared to 49 percent at December 31,
2005. Asia Pacific emerging markets exposure increased by $3.4 billion.
Growth was driven by higher cross-border sovereign and corporate secu-
rities trading exposure, primarily in South Korea, India and Singapore, as
well as higher other financing exposure in India. Our exposure in China
was primarily related to our investment in CCB at both December 31,
2006 and 2005.
In December 2006, the Corporation completed the sale of its Asia
Commercial Banking business to CCB. Our corporate banking and whole-
sale franchises are not impacted by this sale.
At December 31, 2006, 36 percent of the emerging markets
exposure was in Latin America compared to 47 percent at December 31,
2005. Lower exposures in Brazil and Chile were partially offset by an
increase in Mexico. The decline in Brazil was related to the sale of our
Brazilian operations in September 2006 in exchange principally for equity
in Banco Itaú. As of December 31, 2006, our investment in Banco Itaú
accounted for $1.9 billion of exposure in Brazil. The decline in Chile was
due to higher local liabilities which reduced our local exposure.
In August 2006, we announced a definitive agreement to sell our
operations in Chile and Uruguay for equity in Banco Itaú. These trans-
actions are expected to close in early 2007. Subsequent to the sale of our
Brazilian operations and the closing of the Chile and Uruguay transactions,
the Corporation will hold approximately seven percent of the equity of
Banco Itaú through voting and non-voting shares.
The increased exposures in Mexico were attributable to higher cross-
border corporate securities trading exposure. Our 24.9 percent investment
in Santander accounted for $2.3 billion and $2.1 billion of exposure in
Mexico at December 31, 2006 and 2005.
In December 2005, we announced a definitive agreement with a
consortium led by Johannesburg-based Standard Bank Group Limited for
the sale of our assets and the assumption of our liabilities in Argentina.
This transaction is expected to close in early 2007.
Provision for Credit Losses
The Provision for Credit Losses was $5.0 billion, a $996 million, or 25
percent, increase over 2005.
The consumer portion of the Provision for Credit Losses increased
$367 million to $4.8 billion compared to 2005. This increase was primar-
ily driven by the addition of MBNA, partially offset by lower bankruptcy-
related costs on the domestic consumer credit card portfolio. On the
domestic consumer credit card portfolio, lower bankruptcy charge-offs
72
Bank of America 2006