Bank of America 2006 Annual Report Download - page 45
Download and view the complete annual report
Please find page 45 of the 2006 Bank of America annual report below. You can navigate through the pages in the report by either clicking on the pages listed below, or by using the keyword search tool below to find specific information within the annual report.-
 1
1 -
2
-
3
-
4
-
5
-
6
-
7
-
8
-
9
-
10
-
11
-
12
-
13
-
14
-
15
-
16
-
17
-
18
-
19
-
20
-
21
-
22
-
23
-
24
-
25
-
26
-
27
-
28
-
29
-
30
-
31
-
32
-
33
-
34
-
 35
35 -
 36
36 -
 37
37 -
 38
38 -
 39
39 -
 40
40 -
 41
41 -
 42
42 -
 43
43 -
 44
44 -
 45
45 -
 46
46 -
 47
47 -
 48
48 -
 49
49 -
 50
50 -
 51
51 -
 52
52 -
 53
53 -
 54
54 -
 55
55 -
56
-
57
-
58
-
59
-
60
-
61
-
62
-
63
-
64
-
65
-
66
-
67
-
68
-
69
-
70
-
71
-
72
-
73
-
74
-
75
-
76
-
77
-
78
-
79
-
80
-
81
-
82
-
83
-
84
-
85
-
86
-
87
-
88
-
89
-
90
-
91
-
92
-
93
-
94
-
95
-
96
-
97
-
98
-
99
-
100
-
101
-
102
-
103
-
104
-
105
-
106
-
107
-
108
-
109
-
110
-
111
-
112
-
113
-
114
-
115
-
116
-
117
-
118
-
119
-
120
-
121
-
122
-
123
-
124
-
125
-
126
-
127
-
128
-
129
-
130
-
131
-
132
-
133
-
134
-
135
-
136
-
137
-
138
-
139
-
140
-
141
-
142
-
143
-
144
-
145
-
146
-
147
-
148
-
149
-
150
-
151
-
152
-
153
-
154
-
155
 |
 |

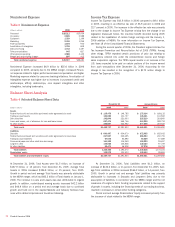
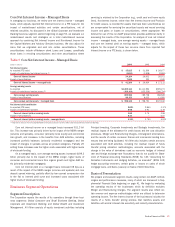
Core Net Interest Income – Managed Basis
In managing our business, we review core net interest income – managed
basis, which adjusts reported Net Interest Income on a FTE basis for the
impact of market-based activities and certain securitizations, net of
retained securities. As discussed in the Global Corporate and Investment
Banking business segment section beginning on page 50, we evaluate our
market-based results and strategies on a total market-based revenue
approach by combining Net Interest Income and Noninterest Income for
the Capital Markets and Advisory Services business. We also adjust for
loans that we originated and sold into certain securitizations. These
securitizations include off-balance sheet Loans and Leases, specifically
those loans in revolving securitizations and other securitizations where
servicing is retained by the Corporation (e.g., credit card and home equity
lines). Noninterest Income, rather than Net Interest Income and Provision
for Credit Losses, is recorded for assets that have been securitized as we
are compensated for servicing the securitized assets and record servicing
income and gains or losses on securitizations, where appropriate. We
believe the use of this non-GAAP presentation provides additional clarity in
assessing the results of the Corporation. An analysis of core net interest
income – managed basis, core average earning assets – managed basis
and core net interest yield on earning assets – managed basis, which
adjusts for the impact of these two non-core items from reported Net
Interest Income on a FTE basis, is shown below.
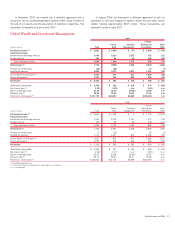
Table 7 Core Net Interest Income – Managed Basis
(Dollars in millions) 2006 2005 2004
Net interest income
As reported (FTE basis)
$ 35,815
$ 31,569 $ 28,677
Impact of market-based net interest income
(1)
(1,651)
(1,938) (2,606)
Core net interest income
34,164
29,631 26,071
Impact of securitizations
7,045
323 1,040
Core net interest income – managed basis
$ 41,209
$ 29,954 $ 27,111
Average earning assets
As reported
$1,269,144
$1,111,994 $905,273
Impact of market-based earning assets
(1)
(369,164)
(322,236) (246,704)
Core average earning assets
899,980
789,758 658,569
Impact of securitizations
98,152
9,033 13,591
Core average earning assets – managed basis
$ 998,132
$ 798,791 $672,160
Net interest yield contribution
As reported (FTE basis)
2.82%
2.84% 3.17%
Impact of market-based activities
0.98
0.91 0.79
Core net interest yield on earning assets
3.80
3.75 3.96
Impact of securitizations
0.33
– 0.07
Core net interest yield on earning assets – managed basis
4.13%
3.75% 4.03%
(1) Represents amounts from the Capital Markets and Advisory Services business within Global Corporate and Investment Banking.
Core net interest income on a managed basis increased $11.3 bil-
lion. This increase was primarily driven by the impact of the MBNA merger
(volumes and spreads), consumer (primarily home equity) and commercial
loan growth, and increases in the benefits from ALM activities, including
increased portfolio balances (primarily residential mortgages) and the
impact of changes in spreads across all product categories. Partially off-
setting these increases was the higher costs associated with higher levels
of wholesale funding.
On a managed basis, core average earning assets increased $199.3
billion primarily due to the impact of the MBNA merger, higher levels of
consumer and commercial loans from organic growth and higher ALM lev-
els (primarily residential mortgages).
Core net interest yield on a managed basis increased 38 bps as a
result of the impact of the MBNA merger (volumes and spreads) and core
deposit spread widening, partially offset by loan spread compression due
to the flat to inverted yield curve and increased costs associated with
higher levels of wholesale funding.
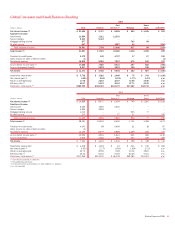
Business Segment Operations
Segment Description
The Corporation reports the results of its operations through three busi-
ness segments: Global Consumer and Small Business Banking, Global
Corporate and Investment Banking, and Global Wealth and Investment
Management.All Other consists of equity investment activities including
Principal Investing, Corporate Investments and Strategic Investments, the
residual impact of the allowance for credit losses and the cost allocation
processes, Merger and Restructuring Charges, intersegment eliminations,
and the results of certain consumer finance and commercial lending busi-
nesses that are being liquidated. All Other also includes certain amounts
associated with ALM activities, including the residual impact of funds
transfer pricing allocation methodologies, amounts associated with the
change in the value of derivatives used as economic hedges of interest
rate and foreign exchange rate fluctuations that do not qualify for State-
ment of Financial Accounting Standards (SFAS) No. 133 “Accounting for
Derivative Instruments and Hedging Activities, as amended” (SFAS 133)
hedge accounting treatment, certain gains or losses on sales of whole
mortgage loans, and Gains (Losses) on Sales of Debt Securities.
Basis of Presentation
We prepare and evaluate segment results using certain non-GAAP method-
ologies and performance measures, many of which are discussed in Sup-
plemental Financial Data beginning on page 41. We begin by evaluating
the operating results of the businesses which by definition excludes
Merger and Restructuring Charges. The segment results also reflect cer-
tain revenue and expense methodologies which are utilized to determine
operating income. The Net Interest Income of the businesses includes the
results of a funds transfer pricing process that matches assets and
liabilities with similar interest rate sensitivity and maturity characteristics.
Bank of America 2006
43