Bank of America 2006 Annual Report Download - page 80
Download and view the complete annual report
Please find page 80 of the 2006 Bank of America annual report below. You can navigate through the pages in the report by either clicking on the pages listed below, or by using the keyword search tool below to find specific information within the annual report.-
 1
1 -
2
-
3
-
4
-
5
-
6
-
7
-
8
-
9
-
10
-
11
-
12
-
13
-
14
-
15
-
16
-
17
-
18
-
19
-
20
-
21
-
22
-
23
-
24
-
25
-
26
-
27
-
28
-
29
-
30
-
31
-
32
-
33
-
34
-
35
-
36
-
37
-
38
-
39
-
40
-
41
-
42
-
43
-
44
-
45
-
46
-
47
-
48
-
49
-
50
-
51
-
52
-
53
-
54
-
55
-
56
-
57
-
58
-
59
-
60
-
61
-
62
-
63
-
64
-
65
-
66
-
67
-
68
-
69
-
 70
70 -
 71
71 -
 72
72 -
 73
73 -
 74
74 -
 75
75 -
 76
76 -
 77
77 -
 78
78 -
 79
79 -
 80
80 -
 81
81 -
 82
82 -
 83
83 -
 84
84 -
 85
85 -
 86
86 -
 87
87 -
 88
88 -
 89
89 -
 90
90 -
91
-
92
-
93
-
94
-
95
-
96
-
97
-
98
-
99
-
100
-
101
-
102
-
103
-
104
-
105
-
106
-
107
-
108
-
109
-
110
-
111
-
112
-
113
-
114
-
115
-
116
-
117
-
118
-
119
-
120
-
121
-
122
-
123
-
124
-
125
-
126
-
127
-
128
-
129
-
130
-
131
-
132
-
133
-
134
-
135
-
136
-
137
-
138
-
139
-
140
-
141
-
142
-
143
-
144
-
145
-
146
-
147
-
148
-
149
-
150
-
151
-
152
-
153
-
154
-
155
 |
 |

mentioned scenarios impact core net interest income – managed basis on
short-term financial instruments, debt securities, loans, deposits, borrow-
ings and derivative instruments. In addition, these simulations incorporate
assumptions about balance sheet dynamics such as loan and deposit
growth and pricing, changes in funding mix, and asset and liability repric-
ing and maturity characteristics.
The Balance Sheet Management group analyzes core net interest
income – managed basis forecasts utilizing different rate scenarios, with
the base case utilizing forward interest rates. The Balance Sheet
Management group frequently updates the core net interest income –
managed basis forecast for changing assumptions and differing outlooks
based on economic trends and market conditions. Thus, we continually
monitor our balance sheet position in an effort to maintain an acceptable
level of exposure to interest rate changes.
We prepare forward-looking forecasts of core net interest income –
managed basis. These baseline forecasts take into consideration
expected future business growth, ALM positioning, and the direction of
interest rate movements as implied by forward interest rates. We then
measure and evaluate the impact that alternative interest rate scenarios
have to these baseline forecasts in order to assess interest rate sensi-
tivity under varied conditions. The spot and 12-month forward monthly
average rates used in our respective baseline forecasts at December 31,
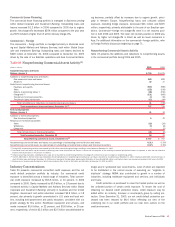
2006 and 2005 were as follows:
Table 29 Forward Rates
December 31
2006 2005
Federal
Funds
Ten-Year
Swap
Federal
Funds
Ten-Year
Swap
Spot rates
5.25% 5.18%
4.25% 4.94%
12-month forward average rates
4.85 5.19
4.75 4.97
The following table reflects the pre-tax dollar impact to forecasted
core net interest income – managed basis over the next twelve months
from December 31, 2006 and 2005, resulting from a 100 bp gradual
parallel increase, a 100 bp gradual parallel decrease, a 100 bp gradual
curve flattening (increase in short-term rates or decrease in long-term
rates) and a 100 bp gradual curve steepening (decrease in short-term
rates or increase in long-term rates) from the forward market curve. For
further discussion of core net interest income – managed basis see
page 43.
The following sensitivity analysis assumes that we take no action in
response to these rate shifts over the indicated years. The estimated
exposure is reported on a managed basis and reflects impacts that may
be realized primarily in Net Interest Income and Card Income. This sensi-
tivity analysis excludes any impact that could occur in the valuation of
retained interests in the Corporation’s securitizations due to changes in
interest rate levels. See Note 9 of the Consolidated Financial Statements
for additional information on Securitizations.
Beyond what is already implied in the forward market curve, the inter-
est rate risk position has become modestly more exposed to rising rates
since December 31, 2005. This exposure is primarily driven by the addi-
tion of MBNA. Conversely, over a 12-month horizon, we would benefit from
falling rates or a steepening of the yield curve beyond what is already
implied in the forward market curve.
As part of our ALM activities, we use securities, residential mort-
gages, and interest rate and foreign exchange derivatives in managing
interest rate sensitivity.
Securities
The securities portfolio is an integral part of our ALM position. During the
third quarter of 2006, we made a strategic shift in our balance sheet
composition strategy to reduce the level of mortgage-backed securities
and thereby reduce the level of investments in debt securities relative to
loans. Accordingly, management targeted a reduction of mortgage-backed
debt securities of approximately $100 billion over the next couple of years
in order to achieve a balance sheet composition that would be consistent
with management’s revised risk-reward profile. Management expects the
total targeted reduction will result from the third quarter sale of $43.7 bil-
lion in mortgage-backed securities combined with expected maturities and
paydowns of mortgage-backed securities over the next couple of years. For
those securities that are in an unrealized loss position we have the intent
and ability to hold these securities to recovery.
The securities portfolio also includes investments to a lesser extent
in corporate, municipal and other investment grade debt securities. The
strategic shift in the balance sheet composition strategy did not impact
these holdings. For those securities that are in an unrealized loss position
we have the intent and ability to hold these securities to recovery.
Table 30 Estimated Core Net Interest Income – Managed Basis at Risk
(Dollars in millions) December 31
Curve Change Short Rate Long Rate 2006 2005
+100 Parallel shift +100 +100
$(557)
$(357)
-100 Parallel shift -100 -100
770
244
Flatteners
Short end +100 –
(687)
(523)
Long end – -100
(192)
(298)
Steepeners
Short end -100 –
971
536
Long end – +100
138
168
78
Bank of America 2006