Bank of America 2006 Annual Report Download - page 48
Download and view the complete annual report
Please find page 48 of the 2006 Bank of America annual report below. You can navigate through the pages in the report by either clicking on the pages listed below, or by using the keyword search tool below to find specific information within the annual report.-
 1
1 -
2
-
3
-
4
-
5
-
6
-
7
-
8
-
9
-
10
-
11
-
12
-
13
-
14
-
15
-
16
-
17
-
18
-
19
-
20
-
21
-
22
-
23
-
24
-
25
-
26
-
27
-
28
-
29
-
30
-
31
-
32
-
33
-
34
-
35
-
36
-
37
-
 38
38 -
 39
39 -
 40
40 -
 41
41 -
 42
42 -
 43
43 -
 44
44 -
 45
45 -
 46
46 -
 47
47 -
 48
48 -
 49
49 -
 50
50 -
 51
51 -
 52
52 -
 53
53 -
 54
54 -
 55
55 -
 56
56 -
 57
57 -
 58
58 -
59
-
60
-
61
-
62
-
63
-
64
-
65
-
66
-
67
-
68
-
69
-
70
-
71
-
72
-
73
-
74
-
75
-
76
-
77
-
78
-
79
-
80
-
81
-
82
-
83
-
84
-
85
-
86
-
87
-
88
-
89
-
90
-
91
-
92
-
93
-
94
-
95
-
96
-
97
-
98
-
99
-
100
-
101
-
102
-
103
-
104
-
105
-
106
-
107
-
108
-
109
-
110
-
111
-
112
-
113
-
114
-
115
-
116
-
117
-
118
-
119
-
120
-
121
-
122
-
123
-
124
-
125
-
126
-
127
-
128
-
129
-
130
-
131
-
132
-
133
-
134
-
135
-
136
-
137
-
138
-
139
-
140
-
141
-
142
-
143
-
144
-
145
-
146
-
147
-
148
-
149
-
150
-
151
-
152
-
153
-
154
-
155
 |
 |

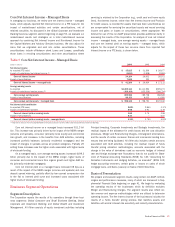
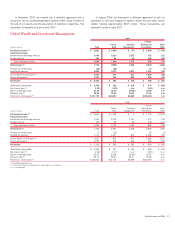
Balance Sheet
Average Balance
(Dollars in millions) 2006 2005
Total loans and leases
$192,072
$144,027
Total earning assets
(1)
328,528
298,904
Total assets
(1)
390,257
326,243
Total deposits
330,072
306,098
Allocated equity
63,121
29,581
December 31
2006 2005
Total loans and leases
$206,040
$151,657
Total earning assets
(1)
319,552
302,619
Total assets
(1)
382,392
331,259
Total deposits
327,236
306,101
Allocated equity
60,373
36,861
(1) Total earning assets and Total Assets include asset allocations to match liabilities (i.e., deposits).
The strategy of Global Consumer and Small Business Banking is to attract,
retain and deepen customer relationships. We achieve this strategy
through our ability to offer a wide range of products and services through a
franchise that stretches coast to coast through 30 states and the District
of Columbia. With the recent merger with MBNA, we also provide credit
card products to customers in Canada, Ireland, Spain and the United
Kingdom. In the U.S., we serve more than 55 million consumer and small
business relationships utilizing our network of 5,747 banking centers,
17,079 domestic branded ATMs, and telephone and Internet channels.
Within Global Consumer and Small Business Banking, there are four pri-
mary businesses: Deposits,Card Services,Mortgage and Home Equity.In
addition, ALM/Other includes the results of ALM activities and other
consumer-related businesses (e.g., insurance).
Net Income increased $4.2 billion, or 59 percent, to $11.2 billion
and Net Interest Income increased $4.2 billion, or 25 percent in 2006
compared to 2005. These increases were primarily due to the MBNA
merger and organic growth which increased Average Loans and Leases.
Noninterest Income increased $9.2 billion, or 80 percent, mainly due
to increases of $8.4 billion in Card Income, $534 million in all other
income and $347 million in Service Charges. Card Income was higher
mainly due to increases in excess servicing income, cash advance fees,
interchange income and late fees due primarily to the impact of the MBNA
merger. All other income increased primarily as a result of the MBNA
merger. Service Charges increased due to new account growth and
increased usage.
The Provision for Credit Losses increased $929 million, or 22 per-
cent, to $5.2 billion in 2006 compared to 2005 primarily resulting from a
$728 million increase in Card Services mainly driven by the MBNA merger.
For further discussion of this increase in the Provision for Credit Losses
related to Card Services, see the Card Services discussion.
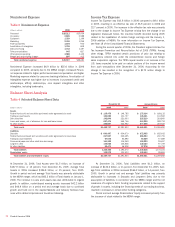
Noninterest Expense increased $5.7 billion, or 43 percent, in 2006
compared to 2005. The primary driver of the increase was the MBNA
merger, which increased most expense items including Personnel, Market-
ing and Amortization of Intangibles. Amortization of Intangibles expense
was higher due to increases in purchased credit card relationships, affinity
relationships, core deposit intangibles and other intangibles, including
trademarks related to the MBNA merger.
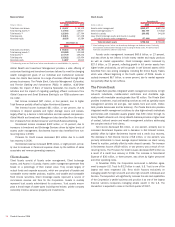
Deposits
Deposits provides a comprehensive range of products to consumers and
small businesses. Our products include traditional savings accounts,
money market savings accounts, CDs and IRAs, and regular and interest-
checking accounts. Debit card results are also included in Deposits.
Deposit products provide a relatively stable source of funding and
liquidity. We earn net interest spread revenues from investing this liquidity
in earning assets through client facing lending activity and our ALM activ-
ities. The revenue is attributed to the deposit products using our funds
transfer pricing process which takes into account the interest rates and
maturity characteristics of the deposits. Deposits also generate various
account fees such as non-sufficient fund fees, overdraft charges and
account service fees while debit cards generate interchange fees. Inter-
change fees are volume based and paid by merchants to have the debit
transactions processed.
We added approximately 2.4 million net new retail checking accounts
and 1.2 million net new retail savings accounts during 2006. These addi-
tions resulted from continued improvement in sales and service results in
the Banking Center Channel, the introduction of products such as Keep
the Change
TM
as well as eCommerce accessibility and customer referrals.
The Corporation migrates qualifying affluent customers, and their
related deposit balances and associated Net Interest Income from the
Global Consumer and Small Business Banking segment to Global Wealth
and Investment Management.
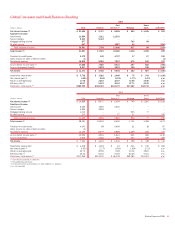
Net Income increased $496 million, or 11 percent, in 2006 com-
pared to 2005. The increase in Net Income was driven by an increase in
Total Revenue of $1.9 billion, or 13 percent compared to 2005. Driving
this growth was an increase of $1.2 billion, or 14 percent, in Net Interest
Income resulting from higher average deposit levels and an increase in
deposit spreads. Average deposits increased $24.0 billion, or eight per-
cent, compared to 2005, primarily due to the MBNA merger. Deposit
spreads increased 17 bps to 3.00 percent, compared to 2005 as we
effectively managed pricing in a rising interest rate environment. The
increase in deposits was partially offset by the migration of deposit balan-
ces to Global Wealth and Investment Management. Noninterest Income
increased $698 million, or 11 percent, driven by higher debit card inter-
change income and higher Service Charges. The increase in debit card
interchange income was primarily due to a higher number of active debit
cards, increased usage, and continued improvements in penetration and
activation rates. Service Charges were higher due to increased
non-sufficient funds fees and overdraft charges, account service charges
and ATM fees resulting from new account growth and increased usage.
Total Noninterest Expense increased $974 million, or 12 percent, in
2006 compared to 2005, primarily driven by costs associated with
increased account volume.
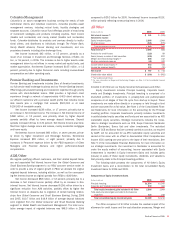
Card Services
Card Services, which excludes the results of debit cards (included in
Deposits), provides a broad offering of products, including U.S. Consumer
and Business Card, Unsecured Lending, Merchant Services and Interna-
tional Card Businesses. As a result of the MBNA merger, we offer a variety
of co-branded and affinity credit card products and have become the lead-
ing issuer of credit cards through endorsed marketing. Prior to the merger
with MBNA, Card Services included U.S. Consumer Card, U.S. Business
Card, and Merchant Services.
We present our Card Services business on both a held and managed
basis (a non-GAAP measure). The performance of the managed portfolio is
important to understanding Card Services’ results as it demonstrates the
results of the entire portfolio serviced by the business, as the receivables
that have been securitized are subject to the same underwriting standards
and ongoing monitoring as the held loans. For assets that have been
securitized, interest income, fee revenue and recoveries in excess of
interest paid to the investors, gross credit losses and other trust
expenses related to the securitized receivables are all reclassified into
46
Bank of America 2006