Bank of America 2006 Annual Report Download - page 69
Download and view the complete annual report
Please find page 69 of the 2006 Bank of America annual report below. You can navigate through the pages in the report by either clicking on the pages listed below, or by using the keyword search tool below to find specific information within the annual report.-
 1
1 -
2
-
3
-
4
-
5
-
6
-
7
-
8
-
9
-
10
-
11
-
12
-
13
-
14
-
15
-
16
-
17
-
18
-
19
-
20
-
21
-
22
-
23
-
24
-
25
-
26
-
27
-
28
-
29
-
30
-
31
-
32
-
33
-
34
-
35
-
36
-
37
-
38
-
39
-
40
-
41
-
42
-
43
-
44
-
45
-
46
-
47
-
48
-
49
-
50
-
51
-
52
-
53
-
54
-
55
-
56
-
57
-
58
-
 59
59 -
 60
60 -
 61
61 -
 62
62 -
 63
63 -
 64
64 -
 65
65 -
 66
66 -
 67
67 -
 68
68 -
 69
69 -
 70
70 -
 71
71 -
 72
72 -
 73
73 -
 74
74 -
 75
75 -
 76
76 -
 77
77 -
 78
78 -
 79
79 -
80
-
81
-
82
-
83
-
84
-
85
-
86
-
87
-
88
-
89
-
90
-
91
-
92
-
93
-
94
-
95
-
96
-
97
-
98
-
99
-
100
-
101
-
102
-
103
-
104
-
105
-
106
-
107
-
108
-
109
-
110
-
111
-
112
-
113
-
114
-
115
-
116
-
117
-
118
-
119
-
120
-
121
-
122
-
123
-
124
-
125
-
126
-
127
-
128
-
129
-
130
-
131
-
132
-
133
-
134
-
135
-
136
-
137
-
138
-
139
-
140
-
141
-
142
-
143
-
144
-
145
-
146
-
147
-
148
-
149
-
150
-
151
-
152
-
153
-
154
-
155
 |
 |

as we are providing offers or commitments for various components of the
clients’ capital structures, including lower rated unsecured and sub-
ordinated debt tranches. In many cases, these offers to finance will not be
accepted. If accepted, these highly conditioned commitments are often
retired prior to or shortly following funding via the placement of securities,
syndication or the client’s decision to terminate. Where we have a binding
commitment and there is a market disruption or other unexpected event,
there may be heightened exposure in the portfolios, an increase in criti-
cized assets and higher potential for loss, unless an orderly disposition of
the exposure can be made.
In Global Corporate and Investment Banking, concentrations are
actively managed through the underwriting and ongoing monitoring proc-
esses, the “originate to distribute” strategy and through the utilization of
various risk mitigation tools, such as credit derivatives, to economically
hedge our risk to certain credit counterparties. Credit derivatives are finan-
cial instruments that we purchase for protection against the deterioration
of credit quality. Earnings volatility increases due to accounting asymmetry
as we mark-to-market the credit derivatives, as required by SFAS 133,
whereas the exposures being hedged, including the funding commitments,
are accounted for on an accrual basis. Once funded, these exposures are
accounted for at historical cost less an allowance for credit losses or, if
held-for-sale, at the lower of cost or market.
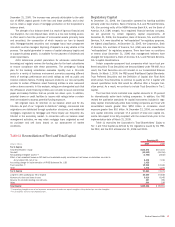
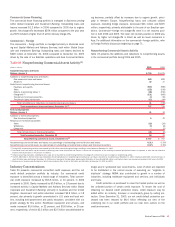
Commercial Credit Portfolio
Commercial credit quality continued to be stable in 2006. At
December 31, 2006, the loans and leases net charge-off ratio declined to
0.13 percent from 0.16 percent at December 31, 2005. The non-
performing loan ratio declined to 0.31 percent from 0.33 percent.
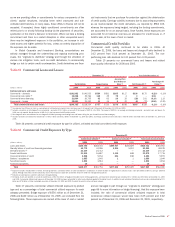
Table 15 presents our commercial loans and leases and related
asset quality information for 2006 and 2005.
Table 15 Commercial Loans and Leases
December 31 Year Ended December 31
Outstandings Nonperforming
Accruing Past
Due 90 Days or
More
(1)
Net Charge-offs
(2)
Net Charge-off
Ratios
(3)
(Dollars in millions) 2006 2005 2006 2005 2006 2005 2006 2005 2006 2005
Commercial loans and leases
Commercial – domestic
$161,982
$140,533
$584
$581
$265
$117
$336
$170
0.22%
0.13%
Commercial real estate
(4)
36,258
35,766
118
49
78
4
3
–
0.01
–
Commercial lease financing
21,864
20,705
42
62
26
15
(28)
231
(0.14)
1.13
Commercial – foreign
20,681
21,330
13
34
9
32
(8)
(72)
(0.04)
(0.39)
Total commercial loans and leases
$240,785
$218,334
$757
$726
$378
$168
$303
$329
0.13%
0.16%
(1) Accruing past due 90 days or more as a percentage of outstanding commercial loans and leases was 0.16 percent and 0.08 percent at December 31, 2006 and 2005.
(2) Includes a reduction in net charge-offs on commercial – domestic of $17 million as a result of the impact of SOP 03-3 for 2006. The impact of SOP 03-3 on average outstanding commercial – domestic loans and leases for
2006 was not material. See discussion of SOP 03-3 in the Consumer Credit Portfolio section.
(3) Net charge-off ratios are calculated as net charge-offs divided by average outstanding loans and leases during the year for each loan and lease category.
(4) Includes domestic commercial real estate loans of $35.7 billion and $35.2 billion at December 31, 2006 and 2005, and foreign commercial real estate loans of $578 million and $585 million at December 31, 2006 and
2005.
Table 16 presents commercial credit exposure by type for utilized, unfunded and total committed credit exposure.
Table 16 Commercial Credit Exposure by Type
December 31
Commercial Utilized
(1)
Commercial Unfunded
(2)
Total Commercial Committed
(Dollars in millions) 2006 2005 2006 2005 2006 2005
Loans and leases
$240,785
$218,334
$269,937
$246,629
$510,722
$464,963
Standby letters of credit and financial guarantees
46,772
43,096
6,234
5,033
53,006
48,129
Derivative assets
(3)
23,439
23,712
—
—
23,439
23,712
Assets held-for-sale
21,936
16,867
1,136
848
23,072
17,715
Commercial letters of credit
4,258
5,154
224
818
4,482
5,972
Bankers’ acceptances
1,885
1,643
1
1
1,886
1,644
Securitized assets
1,292
1,914
—
—
1,292
1,914
Foreclosed properties
10
31
—
—
10
31
Total
$340,377
$310,751
$277,532
$253,329
$617,909
$564,080
(1) Exposure includes standby letters of credit, financial guarantees, commercial letters of credit and bankers’ acceptances for which the bank is legally bound to advance funds under prescribed conditions, during a specified
period. Although funds have not been advanced, most of these exposure types are considered utilized for credit risk management purposes.
(2) Excludes unused business card lines which are not legally binding.
(3) Derivative Assets are reported on a mark-to-market basis, reflect the effects of legally enforceable master netting agreements, and have been reduced by cash collateral of $7.3 billion and $9.3 billion at December 31, 2006
and 2005. Commercial utilized credit exposure at December 31, 2005 has been reclassified to reflect cash collateral applied to Derivative Assets. In addition to cash collateral, Derivative Assets are also collateralized by $7.6
billion and $7.8 billion of other marketable securities at December 31, 2006 and 2005 for which the credit risk has not been reduced.
Table 17 presents commercial utilized criticized exposure by product
type and as a percentage of total commercial utilized exposure for each
category presented. Bridge exposure of $550 million as of December 31,
2006 and $442 million as of December 31, 2005, are excluded from the
following table. These exposures are carried at the lower of cost or market
and are managed in part through our “originate to distribute” strategy (see
page 66 for more information on bridge financing). Had this exposure been
included, the ratio of commercial utilized criticized exposure to total
commercial utilized exposure would have been 2.25 percent and 2.42
percent as of December 31, 2006 and December 31, 2005, respectively.
Bank of America 2006
67