Bank of America 2006 Annual Report Download - page 72
Download and view the complete annual report
Please find page 72 of the 2006 Bank of America annual report below. You can navigate through the pages in the report by either clicking on the pages listed below, or by using the keyword search tool below to find specific information within the annual report.-
 1
1 -
2
-
3
-
4
-
5
-
6
-
7
-
8
-
9
-
10
-
11
-
12
-
13
-
14
-
15
-
16
-
17
-
18
-
19
-
20
-
21
-
22
-
23
-
24
-
25
-
26
-
27
-
28
-
29
-
30
-
31
-
32
-
33
-
34
-
35
-
36
-
37
-
38
-
39
-
40
-
41
-
42
-
43
-
44
-
45
-
46
-
47
-
48
-
49
-
50
-
51
-
52
-
53
-
54
-
55
-
56
-
57
-
58
-
59
-
60
-
61
-
 62
62 -
 63
63 -
 64
64 -
 65
65 -
 66
66 -
 67
67 -
 68
68 -
 69
69 -
 70
70 -
 71
71 -
 72
72 -
 73
73 -
 74
74 -
 75
75 -
 76
76 -
 77
77 -
 78
78 -
 79
79 -
 80
80 -
 81
81 -
 82
82 -
83
-
84
-
85
-
86
-
87
-
88
-
89
-
90
-
91
-
92
-
93
-
94
-
95
-
96
-
97
-
98
-
99
-
100
-
101
-
102
-
103
-
104
-
105
-
106
-
107
-
108
-
109
-
110
-
111
-
112
-
113
-
114
-
115
-
116
-
117
-
118
-
119
-
120
-
121
-
122
-
123
-
124
-
125
-
126
-
127
-
128
-
129
-
130
-
131
-
132
-
133
-
134
-
135
-
136
-
137
-
138
-
139
-
140
-
141
-
142
-
143
-
144
-
145
-
146
-
147
-
148
-
149
-
150
-
151
-
152
-
153
-
154
-
155
 |
 |

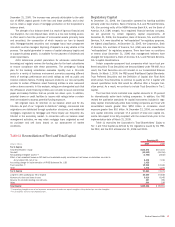
At December 31, 2006 and 2005, we had net notional credit default
protection purchased in our credit derivatives portfolio of $8.3 billion and
$14.7 billion. The net cost of credit default protection, including
mark-to-market impacts, resulted in net losses of $241 million in 2006
compared to net gains of $49 million in 2005. Losses in 2006 primarily
reflected the impact of credit spreads tightening across most of our hedge
positions. The average Value-at-Risk (VAR) for these credit derivative
hedges was $54 million and $69 million for the twelve months ended
December 31, 2006 and 2005. The decrease in VAR was driven by a
decrease in the average amount of credit protection outstanding during the
period. There is a diversification effect between the credit derivative
hedges and the market-based trading portfolio such that their combined
average VAR was $57 million and $62 million for the twelve months ended
December 31, 2006 and 2005. Refer to the discussion on page 76 for a
description of our VAR calculation for the market-based trading portfolio.
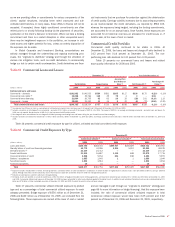
Table 20 Commercial Credit Exposure and Net Credit Default Protection by Industry (1)
December 31
Commercial Utilized
Total Commercial
Committed
Net Credit Default
Protection
(2)
(Dollars in millions) 2006 2005 2006 2005 2006 2005
Real estate (3)
$ 49,208
$ 47,580
$ 73,493
$ 70,373
$ (704)
$ (1,305)
Diversified financials
24,802
24,975
67,027
64,073
(121)
(250)
Retailing
27,226
25,189
44,064
41,967
(581)
(1,134)
Government and public education
22,495
19,041
39,254
33,350
(25)
–
Capital goods
16,804
15,337
37,337
33,004
(402)
(741)
Banks
26,405
21,755
36,735
30,811
(409)
(315)
Consumer services
19,108
17,481
32,651
29,495
(433)
(788)
Healthcare equipment and services
15,787
13,455
31,095
25,494
(249)
(709)
Individuals and trusts
18,792
16,754
29,167
24,348
3
(30)
Materials
15,882
16,754
28,693
28,893
(630)
(1,119)
Commercial services and supplies
15,204
13,038
23,512
21,152
(372)
(472)
Food, beverage and tobacco
11,341
11,194
21,081
20,590
(319)
(580)
Media
8,659
6,701
19,056
15,250
(871)
(1,790)
Energy
9,350
9,061
18,405
17,099
(236)
(589)
Utilities
4,951
5,507
17,221
15,182
(362)
(899)
Transportation
11,451
11,297
17,189
16,980
(219)
(323)
Insurance
6,573
4,745
14,121
13,868
(446)
(1,493)
Religious and social organizations
7,840
7,426
10,507
10,022
–
–
Consumer durables and apparel
4,820
5,142
9,117
9,318
(170)
(475)
Technology hardware and equipment
3,279
3,116
8,046
7,171
(38)
(402)
Telecommunication services
3,513
3,520
7,929
9,193
(1,104)
(1,205)
Pharmaceuticals and biotechnology
2,530
1,675
6,289
4,906
(181)
(470)
Software and services
2,757
2,573
6,206
5,708
(126)
(299)
Automobiles and components
1,529
1,602
5,098
5,878
(483)
(679)
Food and staples retailing
2,153
2,258
4,222
4,241
(116)
(324)
Household and personal products
720
536
2,205
1,669
50
75
Semiconductors and semiconductor equipment
802
536
1,364
1,119
(18)
(54)
Other
6,396
2,503
6,825
2,926
302
(4)
1,677
(4)
Total
$340,377
$310,751
$617,909
$564,080
$(8,260)
$(14,693)
(1) December 31, 2005 industry balances have been reclassified to reflect the realignment of industry codes utilizing Standard & Poor’s industry classifications and internal industry management.
(2) Net notional credit default protection purchased is shown as negative amounts and the net notional credit protection sold is shown as positive amounts.
(3) Industries are viewed from a variety of perspectives to best isolate the perceived risks. For purposes of this table, the real estate industry is defined based upon the borrowers’ or counterparties’ primary business activity using
operating cash flow and primary source of repayment as key factors.
(4) Represents net credit default swaps index positions, including tranched index exposure, which were principally investment grade. Indices are comprised of corporate credit derivatives that trade as an aggregate index value.
Generally, they are grouped into portfolios based on specific ratings of credit quality or global geographic location. As of December 31, 2006 and 2005, credit default swap index positions were sold to reflect our view of the
credit markets.
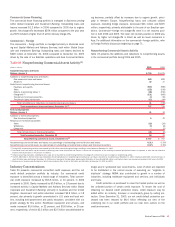
Tables 21 and 22 present the maturity profiles and the credit
exposure debt ratings of the net credit default protection portfolio at
December 31, 2006 and 2005.
Table 21 Net Credit Default Protection by Maturity
Profile
December 31
2006 2005
Less than or equal to one year
7%
–%
Greater than one year and less than or equal to five years
46
65
Greater than five years
47
35
Total
100%
100%
Table 22 Net Credit Default Protection by Credit
Exposure Debt Rating (1)
(Dollars in millions) December 31, 2006 December 31, 2005
Ratings Net Notional Percent Net Notional Percent
AAA
$ (23)
0.3% $ (22) 0.2%
AA
(237)
2.9 (523) 3.6
A
(2,598)
31.5 (4,861) 33.1
BBB
(3,968)
48.0 (8,572) 58.2
BB
(1,341)
16.2 (1,792) 12.2
B
(334)
4.0 (424) 2.9
CCC and below
(50)
0.6 (149) 1.0
NR
(2)
291
(3.5) 1,650 (11.2)
Total
$(8,260)
100.0% $(14,693) 100.0%
(1) In order to mitigate the cost of purchasing credit protection, credit exposure can be added by selling
credit protection. The distribution of debt rating for net notional credit default protection purchased is
shown as negative amounts and the net notional credit protection sold is shown as positive amounts.
(2) In addition to unrated names, “NR” includes $302 million and $1.7 billion in net credit default swaps
index positions at December 31, 2006 and 2005. While index positions are principally investment grade,
credit default swaps indices include names in and across each of the ratings categories.
70
Bank of America 2006