Bank of America 2006 Annual Report Download - page 44
Download and view the complete annual report
Please find page 44 of the 2006 Bank of America annual report below. You can navigate through the pages in the report by either clicking on the pages listed below, or by using the keyword search tool below to find specific information within the annual report.-
 1
1 -
2
-
3
-
4
-
5
-
6
-
7
-
8
-
9
-
10
-
11
-
12
-
13
-
14
-
15
-
16
-
17
-
18
-
19
-
20
-
21
-
22
-
23
-
24
-
25
-
26
-
27
-
28
-
29
-
30
-
31
-
32
-
33
-
 34
34 -
 35
35 -
 36
36 -
 37
37 -
 38
38 -
 39
39 -
 40
40 -
 41
41 -
 42
42 -
 43
43 -
 44
44 -
 45
45 -
 46
46 -
 47
47 -
 48
48 -
 49
49 -
 50
50 -
 51
51 -
 52
52 -
 53
53 -
 54
54 -
55
-
56
-
57
-
58
-
59
-
60
-
61
-
62
-
63
-
64
-
65
-
66
-
67
-
68
-
69
-
70
-
71
-
72
-
73
-
74
-
75
-
76
-
77
-
78
-
79
-
80
-
81
-
82
-
83
-
84
-
85
-
86
-
87
-
88
-
89
-
90
-
91
-
92
-
93
-
94
-
95
-
96
-
97
-
98
-
99
-
100
-
101
-
102
-
103
-
104
-
105
-
106
-
107
-
108
-
109
-
110
-
111
-
112
-
113
-
114
-
115
-
116
-
117
-
118
-
119
-
120
-
121
-
122
-
123
-
124
-
125
-
126
-
127
-
128
-
129
-
130
-
131
-
132
-
133
-
134
-
135
-
136
-
137
-
138
-
139
-
140
-
141
-
142
-
143
-
144
-
145
-
146
-
147
-
148
-
149
-
150
-
151
-
152
-
153
-
154
-
155
 |
 |

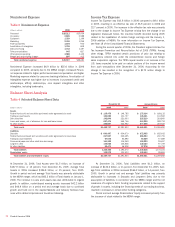
Table 6 Supplemental Financial Data and Reconciliations to GAAP Financial Measures
(Dollars in millions, except per share information) 2006 2005 2004 2003 2002
Operating basis (1)
Operating earnings
$ 21,640
$ 16,740 $ 14,358 $ 10,762 $ 9,553
Operating earnings per common share
4.78
4.17 3.82 3.62 3.14
Diluted operating earnings per common share
4.70
4.11 3.75 3.55 3.05
Shareholder value added
9,121
6,594 5,718 5,475 4,509
Return on average assets
1.48%
1.32% 1.37% 1.44% 1.46%
Return on average common shareholders’ equity
16.66
16.79 16.96 21.50 19.96
Return on average tangible shareholders’ equity
33.59
30.70 29.79 27.84 26.01
Operating efficiency ratio (FTE basis)
46.86
49.66 53.13 52.38 51.84
Dividend payout ratio
44.59
45.84 44.98 39.76 38.79
Operating leverage
7.25
7.48 (1.85) (1.12) n/a
FTE basis data
Net interest income
$ 35,815
$ 31,569 $ 28,677 $ 21,149 $ 20,705
Total revenue
74,247
56,923 49,682 38,478 35,579
Net interest yield
2.82%
2.84% 3.17% 3.26% 3.63%
Efficiency ratio
47.94
50.38 54.37 52.38 51.84
Reconciliation of net income to operating earnings
Net income
$ 21,133
$ 16,465 $ 13,947 $ 10,762 $ 9,553
Merger and restructuring charges
805
412 618 – –
Related income tax benefit
(298)
(137) (207) – –
Operating earnings
$ 21,640
$ 16,740 $ 14,358 $ 10,762 $ 9,553
Reconciliation of average shareholders’ equity to average tangible shareholders’ equity
Average shareholders’ equity
$130,463
$ 99,861 $ 84,815 $ 50,091 $ 47,898
Average goodwill
(66,040)
(45,331) (36,612) (11,440) (11,171)
Average tangible shareholders’ equity
$ 64,423
$ 54,530 $ 48,203 $ 38,651 $ 36,727
Reconciliation of EPS to operating EPS
Earnings per common share
$ 4.66
$ 4.10 $ 3.71 $ 3.62 $ 3.14
Effect of merger and restructuring charges, net of tax benefit
0.12
0.07 0.11 – –
Operating earnings per common share
$ 4.78
$ 4.17 $ 3.82 $ 3.62 $ 3.14
Reconciliation of diluted EPS to diluted operating EPS
Diluted earnings per common share
$ 4.59
$ 4.04 $ 3.64 $ 3.55 $ 3.05
Effect of merger and restructuring charges, net of tax benefit
0.11
0.07 0.11 – –
Diluted operating earnings per common share
$ 4.70
$ 4.11 $ 3.75 $ 3.55 $ 3.05
Reconciliation of net income to shareholder value added
Net income
$ 21,133
$ 16,465 $ 13,947 $ 10,762 $ 9,553
Amortization of intangibles
1,755
809 664 217 218
Merger and restructuring charges, net of tax benefit
507
275 411 – –
Cash basis earnings on an operating basis
23,395
17,549 15,022 10,979 9,771
Capital charge
(14,274)
(10,955) (9,304) (5,504) (5,262)
Shareholder value added
$ 9,121
$ 6,594 $ 5,718 $ 5,475 $ 4,509
Reconciliation of return on average assets to operating return on average assets
Return on average assets
1.44%
1.30% 1.34% 1.44% 1.46%
Effect of merger and restructuring charges, net of tax benefit
0.04
0.02 0.03 – –
Operating return on average assets
1.48%
1.32% 1.37% 1.44% 1.46%
Reconciliation of return on average common shareholders’ equity to operating return on
average common shareholders’ equity
Return on average common shareholders’ equity
16.27%
16.51% 16.47% 21.50% 19.96%
Effect of merger and restructuring charges, net of tax benefit
0.39
0.28 0.49 – –
Operating return on average common shareholders’ equity
16.66%
16.79% 16.96% 21.50% 19.96%
Reconciliation of return on average tangible shareholders’ equity to operating return on
average tangible shareholders’ equity
Return on average tangible shareholders’ equity
32.80%
30.19% 28.93% 27.84% 26.01%
Effect of merger and restructuring charges, net of tax benefit
0.79
0.51 0.86 – –
Operating return on average tangible shareholders’ equity
33.59%
30.70% 29.79% 27.84% 26.01%
Reconciliation of efficiency ratio to operating efficiency ratio (FTE basis)
Efficiency ratio
47.94%
50.38% 54.37% 52.38% 51.84%
Effect of merger and restructuring charges
(1.08)
(0.72) (1.24) – –
Operating efficiency ratio
46.86%
49.66% 53.13% 52.38% 51.84%
Reconciliation of dividend payout ratio to operating dividend payout ratio
Dividend payout ratio
45.66%
46.61% 46.31% 39.76% 38.79%
Effect of merger and restructuring charges, net of tax benefit
(1.07)
(0.77) (1.33) – –
Operating dividend payout ratio
44.59%
45.84% 44.98% 39.76% 38.79%
Reconciliation of operating leverage to operating basis operating leverage
Operating leverage
6.32%
8.40% (4.91)% (1.12)% n/a
Effect of merger and restructuring charges
0.93
(0.92) 3.06 – n/a
Operating leverage
7.25%
7.48% (1.85)% (1.12)% n/a
(1) Operating basis excludes Merger and Restructuring Charges which were $805 million, $412 million, and $618 million in 2006, 2005, and 2004.
n/a = not available
42
Bank of America 2006