Bank of America 2006 Annual Report Download - page 119
Download and view the complete annual report
Please find page 119 of the 2006 Bank of America annual report below. You can navigate through the pages in the report by either clicking on the pages listed below, or by using the keyword search tool below to find specific information within the annual report.-
 1
1 -
2
-
3
-
4
-
5
-
6
-
7
-
8
-
9
-
10
-
11
-
12
-
13
-
14
-
15
-
16
-
17
-
18
-
19
-
20
-
21
-
22
-
23
-
24
-
25
-
26
-
27
-
28
-
29
-
30
-
31
-
32
-
33
-
34
-
35
-
36
-
37
-
38
-
39
-
40
-
41
-
42
-
43
-
44
-
45
-
46
-
47
-
48
-
49
-
50
-
51
-
52
-
53
-
54
-
55
-
56
-
57
-
58
-
59
-
60
-
61
-
62
-
63
-
64
-
65
-
66
-
67
-
68
-
69
-
70
-
71
-
72
-
73
-
74
-
75
-
76
-
77
-
78
-
79
-
80
-
81
-
82
-
83
-
84
-
85
-
86
-
87
-
88
-
89
-
90
-
91
-
92
-
93
-
94
-
95
-
96
-
97
-
98
-
99
-
100
-
101
-
102
-
103
-
104
-
105
-
106
-
107
-
108
-
 109
109 -
 110
110 -
 111
111 -
 112
112 -
 113
113 -
 114
114 -
 115
115 -
 116
116 -
 117
117 -
 118
118 -
 119
119 -
 120
120 -
 121
121 -
 122
122 -
 123
123 -
 124
124 -
 125
125 -
 126
126 -
 127
127 -
 128
128 -
 129
129 -
130
-
131
-
132
-
133
-
134
-
135
-
136
-
137
-
138
-
139
-
140
-
141
-
142
-
143
-
144
-
145
-
146
-
147
-
148
-
149
-
150
-
151
-
152
-
153
-
154
-
155
 |
 |

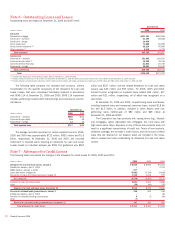
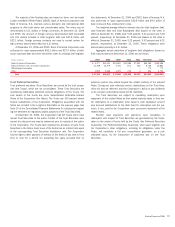
The expected maturity distribution of the Corporation’s mortgage-backed
securities and the contractual maturity distribution of the Corporation’s other
debt securities, and the yields of the Corporation’s AFS debt securities portfo-
lio at December 31, 2006 are summarized in the following table.
Actual maturities may differ from the contractual or expected maturities
shown below since borrowers may have the right to prepay obligations with or
without prepayment penalties.
Due in one year
or less
Due after one year
through five years
Due after five years
through ten years
Due after
ten years
(1)
Total
(Dollars in millions) Amount Yield
(2)
Amount Yield
(2)
Amount Yield
(2)
Amount Yield
(2)
Amount Yield
(2)
Fair value of available-for-sale debt securities
U.S. Treasury securities and agency debentures $ 78 4.08% $ 524 3.96% $ 80 4.31% $ 6 5.73% $ 688 4.03%
Mortgage-backed securities 17 5.59 11,456 4.40 143,370 5.04 2,050 8.62 156,893 5.04
Foreign securities 819 4.88 6,177 5.27 4,949 5.37 105 6.27 12,050 5.29
Other taxable securities 3,581 4.70 10,435 5.19 2,237 5.33 399 6.40 16,652 5.13
Total taxable 4,495 4.73 28,592 4.87 150,636 5.06 2,560 8.17 186,283 5.06
Tax-exempt securities
(3)
1,000 5.82 1,169 5.90 3,226 5.82 1,128 6.44 6,523 5.94
Total available-for-sale debt securities $ 5,495 4.93% $29,761 4.91% $153,862 5.07% $3,688 7.64% $192,806 5.09%
Amortized cost of available-for-sale debt securities $ 5,495 $30,293 $158,301 $3,696 $197,785
(1) Includes securities with no stated maturity.
(2) Yields are calculated based on the amortized cost of the securities.
(3) Yield of tax-exempt securities calculated on a fully taxable-equivalent (FTE) basis.
The components of realized gains and losses on sales of debt securities for 2006, 2005 and 2004 were:
(Dollars in millions) 2006 2005 2004
Gross gains
$87
$1,154 $2,270
Gross losses
(530)
(70) (546)
Net gains (losses) on sales of debt securities
$(443)
$1,084 $1,724
The Income Tax Expense (Benefit) attributable to realized net gains
(losses) on debt securities sales was $(163) million, $400 million, and
$640 million in 2006, 2005 and 2004, respectively.
Pursuant to an agreement dated June 17, 2005, the Corporation
agreed to purchase approximately nine percent, or 19.1 billion shares, of
the stock of China Construction Bank (CCB). These shares are accounted
for at cost as they are non-transferable until the third anniversary of the
initial public offering in October 2008. The Corporation also holds an
option to increase its ownership interest in CCB to 19.9 percent. This
option expires in February 2011. At December 31, 2006, the investment
in the CCB shares was included in Other Assets.
Additionally, the Corporation sold its Brazilian operations to Banco
Itaú Holding Financeira S.A. (Banco Itaú) for approximately $1.9 billion in
preferred stock. These shares are non-transferable for three years from
the date of the agreement dated May 1, 2006 and are accounted for at
cost. The sale closed in September 2006. At December 31, 2006, this
$1.9 billion of preferred stock was included in Other Assets.
The shares of CCB and Banco Itaú are currently carried at cost but,
as required by GAAP, will be accounted for as AFS marketable equity secu-
rities and carried at fair value with an offset to Accumulated OCI beginning
in the fourth quarter of 2007 and second quarter of 2008, respectively.
The fair values of the CCB shares and Banco Itaú shares were approx-
imately $12.2 billion and $2.5 billion at December 31, 2006.
Bank of America 2006
117