Bank of America 2006 Annual Report Download - page 152
Download and view the complete annual report
Please find page 152 of the 2006 Bank of America annual report below. You can navigate through the pages in the report by either clicking on the pages listed below, or by using the keyword search tool below to find specific information within the annual report.-
 1
1 -
2
-
3
-
4
-
5
-
6
-
7
-
8
-
9
-
10
-
11
-
12
-
13
-
14
-
15
-
16
-
17
-
18
-
19
-
20
-
21
-
22
-
23
-
24
-
25
-
26
-
27
-
28
-
29
-
30
-
31
-
32
-
33
-
34
-
35
-
36
-
37
-
38
-
39
-
40
-
41
-
42
-
43
-
44
-
45
-
46
-
47
-
48
-
49
-
50
-
51
-
52
-
53
-
54
-
55
-
56
-
57
-
58
-
59
-
60
-
61
-
62
-
63
-
64
-
65
-
66
-
67
-
68
-
69
-
70
-
71
-
72
-
73
-
74
-
75
-
76
-
77
-
78
-
79
-
80
-
81
-
82
-
83
-
84
-
85
-
86
-
87
-
88
-
89
-
90
-
91
-
92
-
93
-
94
-
95
-
96
-
97
-
98
-
99
-
100
-
101
-
102
-
103
-
104
-
105
-
106
-
107
-
108
-
109
-
110
-
111
-
112
-
113
-
114
-
115
-
116
-
117
-
118
-
119
-
120
-
121
-
122
-
123
-
124
-
125
-
126
-
127
-
128
-
129
-
130
-
131
-
132
-
133
-
134
-
135
-
136
-
137
-
138
-
139
-
140
-
141
-
 142
142 -
 143
143 -
 144
144 -
 145
145 -
 146
146 -
 147
147 -
 148
148 -
 149
149 -
 150
150 -
 151
151 -
 152
152 -
 153
153 -
 154
154 -
 155
155
 |
 |

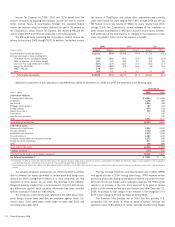
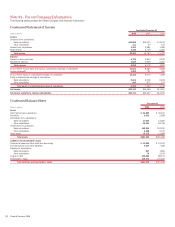
Note 22 – Performance by Geographical Area
Since the Corporation’s operations are highly integrated, certain asset,
liability, income and expense amounts must be allocated to arrive at Total
Assets, Total Revenue, Income Before Income Taxes and Net Income by
geographic area. The Corporation identifies its geographic performance
based upon the business unit structure used to manage the capital or
expense deployed in the region as applicable. This requires certain judg-
ments related to the allocation of revenue so that revenue can be
appropriately matched with the related expense or capital deployed in the
region.
At December 31 Year Ended December 31
(Dollars in millions) Year Total Assets
(1)
Total Revenue
(2)
Income
Before
Income Taxes
Net
Income
Domestic
(3)
2006 $1,300,711 $64,189 $28,041 $18,605
2005
1,183,953 51,860 21,880 14,778
2004
45,767 19,369 12,943
Asia
2006 32,886 1,117 637 420
2005
32,272 909 521 344
2004
718 286 204
Europe, Middle East and Africa
2006 113,129 5,470 1,843 1,193
2005
57,226 1,783 920 603
2004
1,420 605 395
Latin America and the Caribbean
2006 13,011 2,247 1,452 915
2005
18,352 1,539 1,159 740
2004
1,060 648 405
Total Foreign
2006 159,026 8,834 3,932 2,528
2005
107,850 4,231 2,600 1,687
2004
3,198 1,539 1,004
Total Consolidated
2006 $1,459,737 $73,023 $31,973 $21,133
2005
1,291,803 56,091 24,480 16,465
2004
48,965 20,908 13,947
(1) Total Assets includes long-lived assets, which are primarily located in the U.S.
(2) There were no material intercompany revenues between geographic regions for any of the periods presented.
(3) Includes the Corporation’s Canadian operations, which had Total Assets of $7.9 billion and $4.3 billion at December 31, 2006 and 2005; Total Revenue of $641 million, $115 million and $90 million; Income Before Income
Taxes of $244 million, $67 million and $49 million; and Net Income of $159 million, $56 million and $41 million for the years ended December 31, 2006, 2005 and 2004, respectively.
150
Bank of America 2006