Bank of America 2006 Annual Report Download - page 70
Download and view the complete annual report
Please find page 70 of the 2006 Bank of America annual report below. You can navigate through the pages in the report by either clicking on the pages listed below, or by using the keyword search tool below to find specific information within the annual report.-
 1
1 -
2
-
3
-
4
-
5
-
6
-
7
-
8
-
9
-
10
-
11
-
12
-
13
-
14
-
15
-
16
-
17
-
18
-
19
-
20
-
21
-
22
-
23
-
24
-
25
-
26
-
27
-
28
-
29
-
30
-
31
-
32
-
33
-
34
-
35
-
36
-
37
-
38
-
39
-
40
-
41
-
42
-
43
-
44
-
45
-
46
-
47
-
48
-
49
-
50
-
51
-
52
-
53
-
54
-
55
-
56
-
57
-
58
-
59
-
 60
60 -
 61
61 -
 62
62 -
 63
63 -
 64
64 -
 65
65 -
 66
66 -
 67
67 -
 68
68 -
 69
69 -
 70
70 -
 71
71 -
 72
72 -
 73
73 -
 74
74 -
 75
75 -
 76
76 -
 77
77 -
 78
78 -
 79
79 -
 80
80 -
81
-
82
-
83
-
84
-
85
-
86
-
87
-
88
-
89
-
90
-
91
-
92
-
93
-
94
-
95
-
96
-
97
-
98
-
99
-
100
-
101
-
102
-
103
-
104
-
105
-
106
-
107
-
108
-
109
-
110
-
111
-
112
-
113
-
114
-
115
-
116
-
117
-
118
-
119
-
120
-
121
-
122
-
123
-
124
-
125
-
126
-
127
-
128
-
129
-
130
-
131
-
132
-
133
-
134
-
135
-
136
-
137
-
138
-
139
-
140
-
141
-
142
-
143
-
144
-
145
-
146
-
147
-
148
-
149
-
150
-
151
-
152
-
153
-
154
-
155
 |
 |

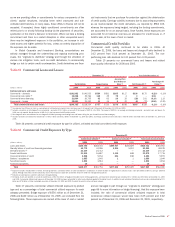
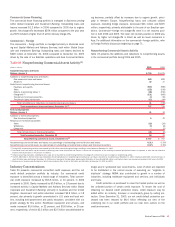
Table 17 Commercial Utilized Criticized Exposure (1,2)
December 31, 2006 December 31, 2005
(Dollars in millions) Amount Percent
(3)
Amount Percent
(3,4)
Commercial – domestic
$5,210 2.41%
$4,954 2.59%
Commercial real estate
815 1.78
723 1.63
Commercial lease financing
504 2.31
611 2.95
Commercial – foreign
582 1.05
797 1.48
Total commercial utilized criticized exposure
$7,111 2.09%
$7,085 2.28%
(1) Criticized exposure corresponds to the Special Mention, Substandard and Doubtful asset categories defined by regulatory authorities.
(2) Exposure includes standby letters of credit, financial guarantees, commercial letters of credit and bankers’ acceptances for which the bank is legally bound to advance funds under prescribed conditions, during a specified
period. Although funds have not been advanced, most of these exposure types are considered utilized for credit risk management purposes.
(3) Ratios are calculated as commercial utilized criticized exposure divided by total commercial utilized exposure for each exposure category.
(4) Commercial – domestic and Total commercial criticized exposure ratios for December 31, 2005 have been reclassified to reflect cash collateral applied to Derivative Assets that are in total commercial utilized credit exposure.
Commercial – Domestic
At December 31, 2006, approximately 80 percent of the commercial—
domestic portfolio was included in Business Lending (business banking,
middle market and large multinational corporate loans and leases) and
Capital Markets and Advisory Services (acquisition and bridge financing),
both within Global Corporate and Investment Banking. Outstanding loans
and leases in Global Corporate and Investment Banking increased $11.6
billion to $130.0 billion at December 31, 2006 compared to
December 31, 2005 driven by organic growth. Nonperforming loans and
leases declined by $45 million to $460 million driven by overall improve-
ments in the portfolio. Net charge-offs were up $72 million from 2005 due
to a lower level of recoveries. Criticized utilized exposure, excluding bridge
exposure, remained essentially flat at $4.6 billion.
The remaining 20 percent of the commercial—domestic portfolio is in
Global Wealth and Investment Management (business-purpose loans for
wealthy individuals) and Global Consumer and Small Business Banking
(business card and small business loans). Outstanding loans and leases
increased $9.8 billion to $32.0 billion at December 31, 2006 compared
to December 31, 2005 driven primarily by growth in Global Consumer and
Small Business Banking. Growth was centered in the business card portfo-
lio, including the addition of MBNA, and the small business portfolio.
Nonperforming loans and leases increased $48 million to $124 million
due to seasoning of the small business portfolio and the addition of
MBNA, both within Global Consumer and Small Business Banking. Loans
past due 90 days or more and still accruing interest increased $153 mil-
lion to $215 million primarily attributable to the business card portfolio.
The increase was driven by the adoption of MBNA collection practices that
have historically led to higher delinquencies but lower losses, the addition
of the MBNA business card portfolio and portfolio seasoning. Net charge-
offs were up $94 million from 2005 due to a $134 million increase in
Global Consumer and Small Business Banking, partially offset by a 2006
credit loss recovery in Global Wealth and Investment Management. The
increase in net charge-offs in Global Consumer and Small Business Bank-
ing was due to the addition of MBNA and seasoning of the small business
and business card portfolios. Criticized utilized exposure increased $265
million to $561 million driven by an increase in the business card portfolio
resulting primarily from the addition of MBNA.
Commercial Real Estate
The commercial real estate portfolio is managed in Business Lending
within Global Corporate and Investment Banking and consists of loans
issued primarily to public and private developers, homebuilders and
commercial real estate firms. Outstanding loans and leases increased
$492 million in 2006 compared to 2005. The increase was driven
by business generated predominantly with existing clients across multiple
property types. Utilized criticized exposure increased $92 million to $815
million driven by a $147 million increase in the utilized criticized loan and
lease portfolio, attributable to the deterioration of a number of relatively
small credits in a variety of property types, the largest of which is resi-
dential. The increase was partially offset by improvements centered in
hotels/motels and multiple use commercial properties.
Table 18 presents outstanding commercial real estate loans by geo-
graphic region and property type diversification, excluding those commer-
cial loans and leases secured by owner-occupied real estate. Commercial
loans and leases secured by owner-occupied real estate are made on the
general creditworthiness of the borrower where real estate is obtained as
additional security and the ultimate repayment of the credit is not depend-
ent on the sale, lease and rental, or refinancing of the real estate. For
purposes of this table, commercial real estate reflects loans dependent on
the sale of the real estate as the primary source of repayment. The
increase in residential property type loans was driven by higher utilizations
in the for-sale housing sector due to increased construction and land cost.
Table 18 Outstanding Commercial Real Estate Loans
December 31
(Dollars in millions) 2006 2005
By Geographic Region (1)
California
$ 7,781
$ 7,615
Northeast
6,368
6,337
Southeast
5,097
4,370
Florida
3,898
4,507
Southwest
3,787
3,658
Midwest
2,271
2,595
Northwest
2,053
2,048
Midsouth
2,006
1,485
Other
870
873
Geographically diversified
(2)
1,549
1,693
Non-U.S.
578
585
Total
$36,258
$35,766
By Property Type
Residential
$ 8,151
$ 7,601
Office buildings
4,823
4,984
Apartments
4,277
4,461
Land and land development
3,956
3,715
Shopping centers/retail
3,955
4,165
Industrial/warehouse
3,247
3,031
Multiple use
1,257
996
Hotels/motels
1,185
790
Resorts
180
183
Other
(3)
5,227
5,840
Total
$36,258
$35,766
(1) Distribution is based on geographic location of collateral. Geographic regions are in the U.S. unless
otherwise noted.
(2) The geographically diversified category is comprised primarily of unsecured outstandings to real estate
investment trusts and national homebuilders whose portfolios of properties span multiple geographic
regions.
(3) Represents loans to borrowers whose primary business is commercial real estate, but the exposure is
not secured by the listed property types.
68
Bank of America 2006