Bank of America 2006 Annual Report Download - page 60
Download and view the complete annual report
Please find page 60 of the 2006 Bank of America annual report below. You can navigate through the pages in the report by either clicking on the pages listed below, or by using the keyword search tool below to find specific information within the annual report.-
 1
1 -
2
-
3
-
4
-
5
-
6
-
7
-
8
-
9
-
10
-
11
-
12
-
13
-
14
-
15
-
16
-
17
-
18
-
19
-
20
-
21
-
22
-
23
-
24
-
25
-
26
-
27
-
28
-
29
-
30
-
31
-
32
-
33
-
34
-
35
-
36
-
37
-
38
-
39
-
40
-
41
-
42
-
43
-
44
-
45
-
46
-
47
-
48
-
49
-
 50
50 -
 51
51 -
 52
52 -
 53
53 -
 54
54 -
 55
55 -
 56
56 -
 57
57 -
 58
58 -
 59
59 -
 60
60 -
 61
61 -
 62
62 -
 63
63 -
 64
64 -
 65
65 -
 66
66 -
 67
67 -
 68
68 -
 69
69 -
 70
70 -
71
-
72
-
73
-
74
-
75
-
76
-
77
-
78
-
79
-
80
-
81
-
82
-
83
-
84
-
85
-
86
-
87
-
88
-
89
-
90
-
91
-
92
-
93
-
94
-
95
-
96
-
97
-
98
-
99
-
100
-
101
-
102
-
103
-
104
-
105
-
106
-
107
-
108
-
109
-
110
-
111
-
112
-
113
-
114
-
115
-
116
-
117
-
118
-
119
-
120
-
121
-
122
-
123
-
124
-
125
-
126
-
127
-
128
-
129
-
130
-
131
-
132
-
133
-
134
-
135
-
136
-
137
-
138
-
139
-
140
-
141
-
142
-
143
-
144
-
145
-
146
-
147
-
148
-
149
-
150
-
151
-
152
-
153
-
154
-
155
 |
 |

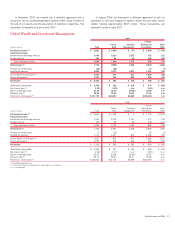
2005, we contributed $2.6 billion and $1.1 billion to the Plans, and we
expect to make at least $192 million of contributions during 2007. Debt,
lease and other obligations are more fully discussed in Notes 12 and 13
of the Consolidated Financial Statements.
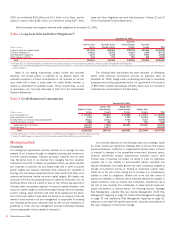
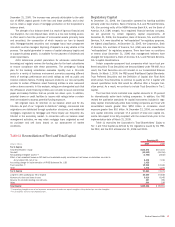
Table 8 presents total long-term debt and other obligations at December 31, 2006.
Table 8 Long-term Debt and Other Obligations (1)
December 31, 2006
(Dollars in millions)
Due in 1 year
or less
Due after 1 year
through 3 years
Due after
3 years through
5 years
Due after
5 years Total
Long-term debt and capital leases
$17,194 $44,962 $20,799 $63,045 $146,000
Purchase obligations
(2)
23,918 22,578 11,234 1,005 58,735
Operating lease obligations
1,375 2,410 1,732 5,951 11,468
Other long-term liabilities
464 676 290 835 2,265
Total
$42,951 $70,626 $34,055 $70,836 $218,468
(1) This table does not include the obligations associated with the Corporation’s Deposits. For more information on Deposits, see Note 11 of the Consolidated Financial Statements.
(2) Obligations that are legally binding agreements whereby we agree to purchase products or services with a specific minimum quantity defined at a fixed, minimum or variable price over a specified period of time are defined as
purchase obligations.
Many of our lending relationships contain funded and unfunded
elements. The funded portion is reflected on our balance sheet. The
unfunded component of these commitments is not recorded on our bal-
ance sheet until a draw is made under the credit facility; however, a
reserve is established for probable losses. These commitments, as well
as guarantees, are more fully discussed in Note 13 of the Consolidated
Financial Statements.
The following table summarizes the total unfunded, or off-balance
sheet, credit extension commitment amounts by expiration date. At
December 31, 2006, charge cards (nonrevolving card lines) to individuals
and government entities guaranteed by the U.S. government in the amount
of $9.6 billion (related outstandings of $193 million) were not included in
credit card line commitments in the table below.
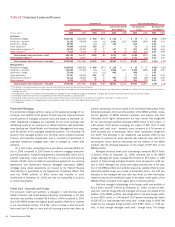
Table 9 Credit Extension Commitments
December 31, 2006
(Dollars in millions)
Expires in 1 year
or less
Expires after
1 year through
3 years
Expires after
3 years through
5 years
Expires after
5 years Total
Loan commitments
(1)
$ 151,604 $60,660 $ 90,988 $ 34,953 $ 338,205
Home equity lines of credit
1,738 1,801 2,742 91,919 98,200
Standby letters of credit and financial guarantees
29,213 10,712 6,744 6,337 53,006
Commercial letters of credit
3,880 180 27 395 4,482
Legally binding commitments
186,435 73,353 100,501 133,604 493,893
Credit card lines
(2)
840,215 13,377 — — 853,592
Total
$1,026,650 $86,730 $100,501 $133,604 $1,347,485
(1) Included at December 31, 2006, are equity commitments of $2.8 billion related to obligations to further fund equity investments.
(2) As part of the MBNA merger, on January 1, 2006, the Corporation acquired $588.4 billion of unused credit card lines.
Managing Risk
Overview
Our management governance structure enables us to manage all major
aspects of our business through an integrated planning and review proc-
ess that includes strategic, financial, associate, customer and risk plan-
ning. We derive much of our revenue from managing risk from customer
transactions for profit. In addition to qualitative factors, we utilize quantita-
tive measures to optimize risk and reward trade offs in order to achieve
growth targets and financial objectives while reducing the variability of
earnings and minimizing unexpected losses. Risk metrics that allow us to
measure performance include economic capital targets, SVA targets and
corporate risk limits. By allocating economic capital to a business unit, we
effectively define that unit’s ability to take on risk. Review and approval of
business plans incorporates approval of economic capital allocation, and
economic capital usage is monitored through financial and risk reporting.
Country, trading, asset allocation and other limits supplement the alloca-
tion of economic capital. These limits are based on an analysis of risk and
reward in each business unit and management is responsible for tracking
and reporting performance measurements as well as any exceptions to
guidelines or limits. Our risk management process continually evaluates
risk and appropriate metrics needed to measure it.
Our business exposes us to the following major risks: strategic, liquid-
ity, credit, market and operational. Strategic Risk is the risk that adverse
business decisions, ineffective or inappropriate business plans or failure
to respond to changes in the competitive environment, business cycles,
customer preferences, product obsolescence, execution and/or other
intrinsic risks of business will impact our ability to meet our objectives.
Liquidity risk is the inability to accommodate liability maturities and
deposit withdrawals, fund asset growth and meet contractual obligations
through unconstrained access to funding at reasonable market rates.
Credit risk is the risk of loss arising from a borrower’s or counterparty’s
inability to meet its obligations. Market risk is the risk that values of
assets and liabilities or revenues will be adversely affected by changes in
market conditions, such as interest rate movements. Operational risk is
the risk of loss resulting from inadequate or failed internal processes,
people and systems or external events. The following sections, Strategic
Risk Management, Liquidity Risk and Capital Management, Credit Risk
Management beginning on page 59, Market Risk Management beginning
on page 75 and Operational Risk Management beginning on page 81,
address in more detail the specific procedures, measures and analyses of
the major categories of risk that we manage.
58
Bank of America 2006