Bank of America 2006 Annual Report Download - page 51
Download and view the complete annual report
Please find page 51 of the 2006 Bank of America annual report below. You can navigate through the pages in the report by either clicking on the pages listed below, or by using the keyword search tool below to find specific information within the annual report.-
 1
1 -
2
-
3
-
4
-
5
-
6
-
7
-
8
-
9
-
10
-
11
-
12
-
13
-
14
-
15
-
16
-
17
-
18
-
19
-
20
-
21
-
22
-
23
-
24
-
25
-
26
-
27
-
28
-
29
-
30
-
31
-
32
-
33
-
34
-
35
-
36
-
37
-
38
-
39
-
40
-
 41
41 -
 42
42 -
 43
43 -
 44
44 -
 45
45 -
 46
46 -
 47
47 -
 48
48 -
 49
49 -
 50
50 -
 51
51 -
 52
52 -
 53
53 -
 54
54 -
 55
55 -
 56
56 -
 57
57 -
 58
58 -
 59
59 -
 60
60 -
 61
61 -
62
-
63
-
64
-
65
-
66
-
67
-
68
-
69
-
70
-
71
-
72
-
73
-
74
-
75
-
76
-
77
-
78
-
79
-
80
-
81
-
82
-
83
-
84
-
85
-
86
-
87
-
88
-
89
-
90
-
91
-
92
-
93
-
94
-
95
-
96
-
97
-
98
-
99
-
100
-
101
-
102
-
103
-
104
-
105
-
106
-
107
-
108
-
109
-
110
-
111
-
112
-
113
-
114
-
115
-
116
-
117
-
118
-
119
-
120
-
121
-
122
-
123
-
124
-
125
-
126
-
127
-
128
-
129
-
130
-
131
-
132
-
133
-
134
-
135
-
136
-
137
-
138
-
139
-
140
-
141
-
142
-
143
-
144
-
145
-
146
-
147
-
148
-
149
-
150
-
151
-
152
-
153
-
154
-
155
 |
 |
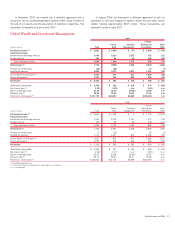
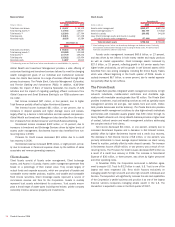
At December 31, 2006, the consumer MSR balance was $2.9 billion,
an increase of $211 million, or eight percent, from December 31, 2005.
This value represented 125 bps of the related unpaid principal balance, a
3 bps increase from December 31, 2005. For additional information, see
Note 8 of the Consolidated Financial Statements.
Home Equity
Home Equity generates revenue by providing an extensive line of home
equity products and services to customers nationwide. Home Equity prod-
ucts include lines of credit and home equity loans and are also available
to our customers through our retail network and our partnership with mort-
gage brokers.
Net Income for Home Equity increased $69 million, or 16 percent, in
2006 compared to 2005. Driving this increase in Net Income was Net
Interest Income, which increased $115 million to $1.4 billion in 2006
compared to 2005, primarily attributable to account growth and larger line
sizes resulting from enhanced product offerings and the expanding home
equity market.
The Home Equity servicing portfolio at December 31, 2006 was
$86.5 billion, $14.9 billion higher than December 31, 2005, driven primar-
ily by increased production. Home Equity production within Global
Consumer and Small Business Banking increased $9.5 billion to $65.4
billion in 2006 compared to 2005.
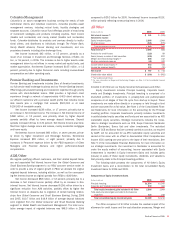
ALM/Other
ALM/Other is comprised primarily of the allocation of a portion of the
Corporation’s Net Interest Income from ALM activities, the residual of the
funds transfer pricing allocation process associated with recording Card
Services securitizations and the results of other consumer-related busi-
nesses (e.g., insurance).
Net Income decreased $898 million for 2006 compared to 2005.
The decrease was primarily a result of a lower contribution from ALM activ-
ities and the impact of the residual of the funds transfer pricing allocation
process associated with Card Services securitizations.
Bank of America 2006
49