Bank of America 2006 Annual Report Download - page 76
Download and view the complete annual report
Please find page 76 of the 2006 Bank of America annual report below. You can navigate through the pages in the report by either clicking on the pages listed below, or by using the keyword search tool below to find specific information within the annual report.-
 1
1 -
2
-
3
-
4
-
5
-
6
-
7
-
8
-
9
-
10
-
11
-
12
-
13
-
14
-
15
-
16
-
17
-
18
-
19
-
20
-
21
-
22
-
23
-
24
-
25
-
26
-
27
-
28
-
29
-
30
-
31
-
32
-
33
-
34
-
35
-
36
-
37
-
38
-
39
-
40
-
41
-
42
-
43
-
44
-
45
-
46
-
47
-
48
-
49
-
50
-
51
-
52
-
53
-
54
-
55
-
56
-
57
-
58
-
59
-
60
-
61
-
62
-
63
-
64
-
65
-
 66
66 -
 67
67 -
 68
68 -
 69
69 -
 70
70 -
 71
71 -
 72
72 -
 73
73 -
 74
74 -
 75
75 -
 76
76 -
 77
77 -
 78
78 -
 79
79 -
 80
80 -
 81
81 -
 82
82 -
 83
83 -
 84
84 -
 85
85 -
 86
86 -
87
-
88
-
89
-
90
-
91
-
92
-
93
-
94
-
95
-
96
-
97
-
98
-
99
-
100
-
101
-
102
-
103
-
104
-
105
-
106
-
107
-
108
-
109
-
110
-
111
-
112
-
113
-
114
-
115
-
116
-
117
-
118
-
119
-
120
-
121
-
122
-
123
-
124
-
125
-
126
-
127
-
128
-
129
-
130
-
131
-
132
-
133
-
134
-
135
-
136
-
137
-
138
-
139
-
140
-
141
-
142
-
143
-
144
-
145
-
146
-
147
-
148
-
149
-
150
-
151
-
152
-
153
-
154
-
155
 |
 |

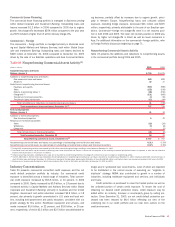
Changes to the reserve for unfunded lending commitments are made
through the Provision for Credit Losses. The reserve for unfunded lending
commitments at December 31, 2006 was $397 million, relatively flat with
December 31, 2005.
Table 26 presents a rollforward of the allowance for credit losses for 2006 and 2005.
Table 26 Allowance for Credit Losses
(Dollars in millions) 2006 2005
Allowance for loan and lease losses, January 1
$ 8,045
$ 8,626
MBNA balance, January 1, 2006
577
–
Loans and leases charged off
Residential mortgage
(74)
(58)
Credit card – domestic
(3,546)
(4,018)
Credit card – foreign
(292)
–
Home equity lines
(67)
(46)
Direct/Indirect consumer
(748)
(380)
Other consumer
(436)
(376)
Total consumer
(5,163)
(4,878)
Commercial – domestic
(597)
(535)
Commercial real estate
(7)
(5)
Commercial lease financing
(28)
(315)
Commercial – foreign
(86)
(61)
Total commercial
(718)
(916)
Total loans and leases charged off
(5,881)
(5,794)
Recoveries of loans and leases previously charged off
Residential mortgage
35
31
Credit card – domestic
452
366
Credit card – foreign
67
–
Home equity lines
16
15
Direct/Indirect consumer
224
132
Other consumer
133
101
Total consumer
927
645
Commercial – domestic
261
365
Commercial real estate
4
5
Commercial lease financing
56
84
Commercial – foreign
94
133
Total commercial
415
587
Total recoveries of loans and leases previously charged off
1,342
1,232
Net charge-offs
(4,539)
(4,562)
Provision for loan and lease losses
5,001
4,021
Other
(68)
(40)
Allowance for loan and lease losses, December 31
9,016
8,045
Reserve for unfunded lending commitments, January 1
395
402
Provision for unfunded lending commitments
9
(7)
Other
(7)
–
Reserve for unfunded lending commitments, December 31
397
395
Total
$ 9,413
$ 8,440
Loans and leases outstanding at December 31
$706,490
$573,791
Allowance for loan and lease losses as a percentage of loans and leases outstanding at
December 31
1.28%
1.40%
Consumer allowance for loan and lease losses as a percentage of consumer loans and
leases outstanding at December 31
1.19
1.27
Commercial allowance for loan and lease losses as a percentage of commercial loans and
leases outstanding at December 31
1.44
1.62
Average loans and leases outstanding during the year
$652,417
$537,218
Net charge-offs as a percentage of average loans and leases outstanding during the year
(1)
0.70%
0.85%
Allowance for loan and lease losses as a percentage of total nonperforming loans and leases at
December 31
505
532
Ratio of the allowance for loan and lease losses at December 31 to net charge-offs
(1)
1.99
1.76
(1) For 2006, the impact of SOP 03-3 decreased net charge-offs by $288 million. Excluding the impact of SOP 03-3, net charge-offs as a percentage of average loans and leases outstanding for 2006 was 0.74 percent, and the
ratio of the Allowance for Loan and Lease Losses to net charge-offs was 1.87 at December 31, 2006.
74
Bank of America 2006