Bank of America 2006 Annual Report Download - page 145
Download and view the complete annual report
Please find page 145 of the 2006 Bank of America annual report below. You can navigate through the pages in the report by either clicking on the pages listed below, or by using the keyword search tool below to find specific information within the annual report.-
 1
1 -
2
-
3
-
4
-
5
-
6
-
7
-
8
-
9
-
10
-
11
-
12
-
13
-
14
-
15
-
16
-
17
-
18
-
19
-
20
-
21
-
22
-
23
-
24
-
25
-
26
-
27
-
28
-
29
-
30
-
31
-
32
-
33
-
34
-
35
-
36
-
37
-
38
-
39
-
40
-
41
-
42
-
43
-
44
-
45
-
46
-
47
-
48
-
49
-
50
-
51
-
52
-
53
-
54
-
55
-
56
-
57
-
58
-
59
-
60
-
61
-
62
-
63
-
64
-
65
-
66
-
67
-
68
-
69
-
70
-
71
-
72
-
73
-
74
-
75
-
76
-
77
-
78
-
79
-
80
-
81
-
82
-
83
-
84
-
85
-
86
-
87
-
88
-
89
-
90
-
91
-
92
-
93
-
94
-
95
-
96
-
97
-
98
-
99
-
100
-
101
-
102
-
103
-
104
-
105
-
106
-
107
-
108
-
109
-
110
-
111
-
112
-
113
-
114
-
115
-
116
-
117
-
118
-
119
-
120
-
121
-
122
-
123
-
124
-
125
-
126
-
127
-
128
-
129
-
130
-
131
-
132
-
133
-
134
-
 135
135 -
 136
136 -
 137
137 -
 138
138 -
 139
139 -
 140
140 -
 141
141 -
 142
142 -
 143
143 -
 144
144 -
 145
145 -
 146
146 -
 147
147 -
 148
148 -
 149
149 -
 150
150 -
 151
151 -
 152
152 -
 153
153 -
 154
154 -
 155
155
 |
 |

The following table presents information on equity compensation
plans at December 31, 2006:
Number of
Shares to be
Issued
(1, 3)
Weighted Average
Exercise Price of
Outstanding
Options
(2)
Number of Shares
Remaining for
Future Issuance
Under Equity
Compensation
Plans
Plans approved by
shareholders
215,115,189
$37.59 304,107,699
Plan not approved by
shareholders
(4)
5,148,042
30.68 –
Total
220,263,231
37.42 304,107,699
(1) Includes 13,871,207 unvested restricted stock units.
(2) Does not take into account unvested restricted stock units.
(3) In addition to the securities presented in the table above, there were outstanding options to purchase
38,681,146 shares of the Corporation’s common stock and 502,760 unvested restricted stock units
granted to employees of predecessor companies assumed in mergers. The weighted average option price
of the assumed options was $34.07 at December 31, 2006.
(4) Shareholder approval of these broad-based stock option plans was not required by applicable law or New
York Stock Exchange rules.
The following table presents the status of all option plans at
December 31, 2006, and changes during 2006:
December 31, 2006
Employee stock options Shares
Weighted
Average
Exercise
Price
Outstanding at January 1, 2006
298,132,802
$35.13
Options assumed through acquisition
31,506,268
32.70
Granted
31,534,150
44.42
Exercised
(111,615,059)
32.93
Forfeited
(4,484,991)
41.48
Outstanding at December 31, 2006
245,073,170
36.89
Options exercisable at December 31, 2006
178,277,236
34.17
Options vested and expected to vest
(1)
244,223,346
36.87
(1) Includes vested shares and nonvested shares after a forfeiture rate is applied.
The weighted average remaining contractual term and aggregate
intrinsic value of options outstanding was 5.7 years and $4.0 billion,
options exercisable was 4.7 years and $3.4 billion, and options vested
and expected to vest was 5.7 years and $4.0 billion at December 31,
2006.
The weighted average grant-date fair value of options granted in
2006, 2005 and 2004 was $6.90, $6.48 and $5.59. The total intrinsic
value of options exercised in 2006 was $2.0 billion.
The following table presents the status of the nonvested shares at
December 31, 2006, and changes during 2006:
December 31, 2006
Restricted stock/unit awards Shares
Weighted
Average
Grant Date
Fair Value
Outstanding at January 1, 2006
27,278,106 $42.79
Share obligations assumed through acquisition
754,740 30.40
Granted
18,128,115 44.43
Vested
(12,319,864) 41.41
Cancelled
(2,251,755) 44.52
Outstanding at December 31, 2006
31,589,342 43.85
At December 31, 2006, there was $766 million of total unrecognized
compensation cost related to share-based compensation arrangements for
all awards that is expected to be recognized over a weighted average
period of .86 years. The total fair value of restricted stock vested in 2006
was $559 million.
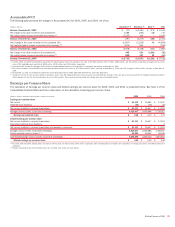
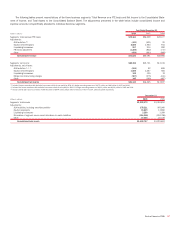
Note 18 – Income Taxes
The components of Income Tax Expense for 2006, 2005 and 2004 were as follows:
(Dollars in millions) 2006 2005 2004
Current income tax expense
Federal
$ 7,398
$5,229 $6,392
State
796
676 683
Foreign
796
415 405
Total current expense
8,990
6,320 7,480
Deferred income tax expense (benefit)
Federal
1,807
1,577 (512)
State
45
85 (23)
Foreign
(2)
33 16
Total deferred expense (benefit)
1,850
1,695 (519)
Total income tax expense (1)
$10,840
$8,015 $6,961
(1) Does not reflect the deferred tax effects of Unrealized Gains and Losses on AFS Debt and Marketable Equity Securities, Foreign Currency Translation Adjustments, Derivatives, and the accumulated adjustment to apply SFAS
No. 158 that are included in Accumulated OCI. As a result of these tax effects, Accumulated OCI increased $378 million, $2,863 million and $303 million in 2006, 2005 and 2004. Also, does not reflect tax benefits
associated with the Corporation’s employee stock plans which increased Common Stock and Additional Paid-in Capital $674 million, $416 million and $401 million in 2006, 2005 and 2004. Goodwill was reduced $195
million, $22 million and $101 million in 2006, 2005 and 2004, reflecting the tax benefits attributable to exercises of employee stock options issued by MBNA and FleetBoston which had vested prior to the merger dates.
Bank of America 2006
143