Bank of America 2006 Annual Report Download - page 40
Download and view the complete annual report
Please find page 40 of the 2006 Bank of America annual report below. You can navigate through the pages in the report by either clicking on the pages listed below, or by using the keyword search tool below to find specific information within the annual report.-
 1
1 -
2
-
3
-
4
-
5
-
6
-
7
-
8
-
9
-
10
-
11
-
12
-
13
-
14
-
15
-
16
-
17
-
18
-
19
-
20
-
21
-
22
-
23
-
24
-
25
-
26
-
27
-
28
-
29
-
 30
30 -
 31
31 -
 32
32 -
 33
33 -
 34
34 -
 35
35 -
 36
36 -
 37
37 -
 38
38 -
 39
39 -
 40
40 -
 41
41 -
 42
42 -
 43
43 -
 44
44 -
 45
45 -
 46
46 -
 47
47 -
 48
48 -
 49
49 -
 50
50 -
51
-
52
-
53
-
54
-
55
-
56
-
57
-
58
-
59
-
60
-
61
-
62
-
63
-
64
-
65
-
66
-
67
-
68
-
69
-
70
-
71
-
72
-
73
-
74
-
75
-
76
-
77
-
78
-
79
-
80
-
81
-
82
-
83
-
84
-
85
-
86
-
87
-
88
-
89
-
90
-
91
-
92
-
93
-
94
-
95
-
96
-
97
-
98
-
99
-
100
-
101
-
102
-
103
-
104
-
105
-
106
-
107
-
108
-
109
-
110
-
111
-
112
-
113
-
114
-
115
-
116
-
117
-
118
-
119
-
120
-
121
-
122
-
123
-
124
-
125
-
126
-
127
-
128
-
129
-
130
-
131
-
132
-
133
-
134
-
135
-
136
-
137
-
138
-
139
-
140
-
141
-
142
-
143
-
144
-
145
-
146
-
147
-
148
-
149
-
150
-
151
-
152
-
153
-
154
-
155
 |
 |

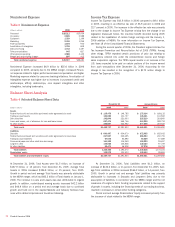
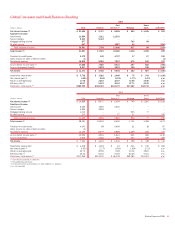
Noninterest Expense
Table 3 Noninterest Expense
(Dollars in millions) 2006 2005
Personnel
$18,211
$15,054
Occupancy
2,826
2,588
Equipment
1,329
1,199
Marketing
2,336
1,255
Professional fees
1,078
930
Amortization of intangibles
1,755
809
Data processing
1,732
1,487
Telecommunications
945
827
Other general operating
4,580
4,120
Merger and restructuring charges
805
412
Total noninterest expense
$35,597
$28,681
Noninterest Expense increased $6.9 billion to $35.6 billion in 2006
compared to 2005, primarily due to the MBNA merger, increased Person-
nel expense related to higher performance-based compensation and higher
Marketing expense related to consumer banking initiatives. Amortization of
Intangibles expense was higher due to increases in purchased credit card
relationships, affinity relationships, core deposit intangibles and other
intangibles, including trademarks.
Income Tax Expense
Income Tax Expense was $10.8 billion in 2006 compared to $8.0 billion
in 2005, resulting in an effective tax rate of 33.9 percent in 2006 and
32.7 percent in 2005. The increase in the effective tax rate was primarily
due to the charge to Income Tax Expense arising from the change in tax
legislation discussed below, the one-time benefit recorded during 2005
related to the repatriation of certain foreign earnings and the January 1,
2006 addition of MBNA. For more information on Income Tax Expense,
see Note 18 of the Consolidated Financial Statements.
During the second quarter of 2006, the President signed into law the
Tax Increase Prevention and Reconciliation Act of 2005 (TIPRA). Among
other things, TIPRA repealed certain provisions of prior law relating to
transactions entered into under the extraterritorial income and foreign
sales corporation regimes. The TIPRA repeal results in an increase in the
U.S. taxes expected to be paid on certain portions of the income earned
from such transactions after December 31, 2006. Accounting for the
change in law resulted in the recognition of a $175 million charge to
Income Tax Expense in 2006.
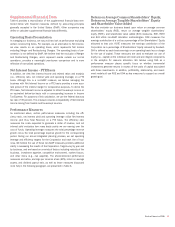
Balance Sheet Analysis
Table 4 Selected Balance Sheet Data
December 31 Average Balance
(Dollars in millions) 2006 2005 2006 2005
Assets
Federal funds sold and securities purchased under agreements to resell
$ 135,478
$ 149,785
$ 175,334
$ 169,132
Trading account assets
153,052
131,707
145,321
133,502
Debt securities
192,846
221,603
225,219
219,843
Loans and leases, net of allowance for loan and lease losses
697,474
565,746
643,259
528,793
All other assets
280,887
222,962
277,548
218,622
Total assets
$1,459,737
$1,291,803
$1,466,681
$1,269,892
Liabilities
Deposits
$ 693,497
$ 634,670
$ 672,995
$ 632,432
Federal funds purchased and securities sold under agreements to repurchase
217,527
240,655
286,903
230,751
Trading account liabilities
67,670
50,890
64,689
57,689
Commercial paper and other short-term borrowings
141,300
116,269
124,229
95,657
Long-term debt
146,000
100,848
130,124
97,709
All other liabilities
58,471
46,938
57,278
55,793
Total liabilities
1,324,465
1,190,270
1,336,218
1,170,031
Shareholders’ equity
135,272
101,533
130,463
99,861
Total liabilities and shareholders’ equity
$1,459,737
$1,291,803
$1,466,681
$1,269,892
At December 31, 2006, Total Assets were $1.5 trillion, an increase of
$167.9 billion, or 13 percent, from December 31, 2005. Average Total
Assets in 2006 increased $196.8 billion, or 15 percent, from 2005.
Growth in period end and average Total Assets was primarily attributable
to the MBNA merger, which had $83.3 billion of Total Assets on January 1,
2006. The increase in Loans and Leases was also attributable to organic
growth. In addition, market-based earning assets increased $42.2 billion
and $46.9 billion on a period end and average basis due to continued
growth and build out in the Capital Markets and Advisory Services busi-
ness within Global Corporate and Investment Banking.
At December 31, 2006, Total Liabilities were $1.3 trillion, an
increase of $134.2 billion, or 11 percent, from December 31, 2005. Aver-
age Total Liabilities in 2006 increased $166.2 billion, or 14 percent, from
2005. Growth in period end and average Total Liabilities was primarily
attributable to increases in Deposits and Long-term Debt, due to the
assumption of liabilities in connection with the MBNA merger and the net
issuances of Long-term Debt. Funding requirements related to the support
of growth in assets, including the financing needs of our trading business,
resulted in increases in certain other funding categories.
Period end and average Shareholders’ Equity increased primarily from
the issuance of stock related to the MBNA merger.
38
Bank of America 2006