Bank of America 2006 Annual Report Download - page 120
Download and view the complete annual report
Please find page 120 of the 2006 Bank of America annual report below. You can navigate through the pages in the report by either clicking on the pages listed below, or by using the keyword search tool below to find specific information within the annual report.-
 1
1 -
2
-
3
-
4
-
5
-
6
-
7
-
8
-
9
-
10
-
11
-
12
-
13
-
14
-
15
-
16
-
17
-
18
-
19
-
20
-
21
-
22
-
23
-
24
-
25
-
26
-
27
-
28
-
29
-
30
-
31
-
32
-
33
-
34
-
35
-
36
-
37
-
38
-
39
-
40
-
41
-
42
-
43
-
44
-
45
-
46
-
47
-
48
-
49
-
50
-
51
-
52
-
53
-
54
-
55
-
56
-
57
-
58
-
59
-
60
-
61
-
62
-
63
-
64
-
65
-
66
-
67
-
68
-
69
-
70
-
71
-
72
-
73
-
74
-
75
-
76
-
77
-
78
-
79
-
80
-
81
-
82
-
83
-
84
-
85
-
86
-
87
-
88
-
89
-
90
-
91
-
92
-
93
-
94
-
95
-
96
-
97
-
98
-
99
-
100
-
101
-
102
-
103
-
104
-
105
-
106
-
107
-
108
-
109
-
 110
110 -
 111
111 -
 112
112 -
 113
113 -
 114
114 -
 115
115 -
 116
116 -
 117
117 -
 118
118 -
 119
119 -
 120
120 -
 121
121 -
 122
122 -
 123
123 -
 124
124 -
 125
125 -
 126
126 -
 127
127 -
 128
128 -
 129
129 -
 130
130 -
131
-
132
-
133
-
134
-
135
-
136
-
137
-
138
-
139
-
140
-
141
-
142
-
143
-
144
-
145
-
146
-
147
-
148
-
149
-
150
-
151
-
152
-
153
-
154
-
155
 |
 |

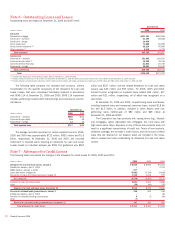
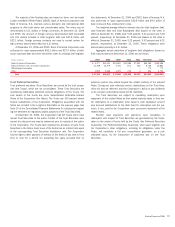
Note 6 – Outstanding Loans and Leases
Outstanding loans and leases at December 31, 2006 and 2005 were:
December 31
(Dollars in millions) 2006 2005
Consumer
Residential mortgage
$241,181
$182,596
Credit card – domestic
61,195
58,548
Credit card – foreign
10,999
–
Home equity lines
74,888
62,098
Direct/Indirect consumer
(1)
68,224
45,490
Other consumer
(2)
9,218
6,725
Total consumer
465,705
355,457
Commercial
Commercial – domestic
161,982
140,533
Commercial real estate
(3)
36,258
35,766
Commercial lease financing
21,864
20,705
Commercial – foreign
20,681
21,330
Total commercial
240,785
218,334
Total
$706,490
$573,791
(1) Includes home equity loans of $12.8 billion and $8.1 billion at December 31, 2006 and 2005.
(2) Includes foreign consumer loans of $6.2 billion and $3.8 billion at December 31, 2006 and 2005 and consumer finance loans of $2.8 billion for both December 31, 2006 and 2005.
(3) Includes domestic commercial real estate loans of $35.7 billion and $35.2 billion, and foreign commercial real estate loans of $578 million and $585 million at December 31, 2006 and 2005.
The following table presents the recorded loan amounts, without
consideration for the specific component of the Allowance for Loan and
Lease Losses, that were considered individually impaired in accordance
with SFAS 114 at December 31, 2006 and 2005. SFAS 114 impairment
includes performing troubled debt restructurings and excludes all commer-
cial leases.
December 31
(Dollars in millions) 2006 2005
Commercial – domestic
$586
$613
Commercial real estate
118
49
Commercial – foreign
13
34
Total impaired loans
$717
$696
The average recorded investment in certain impaired loans for 2006,
2005 and 2004 was approximately $722 million, $852 million and $1.6
billion, respectively. At December 31, 2006 and 2005, the recorded
investment in impaired loans requiring an Allowance for Loan and Lease
Losses based on individual analysis per SFAS 114 guidelines was $567
million and $517 million, and the related Allowance for Loan and Lease
Losses was $43 million and $55 million. For 2006, 2005 and 2004,
Interest Income recognized on impaired loans totaled $36 million, $17
million and $21 million, respectively, all of which was recognized on a
cash basis.
At December 31, 2006 and 2005, nonperforming loans and leases,
including impaired loans and nonaccrual consumer loans, totaled $1.8 bil-
lion and $1.5 billion. In addition, included in Other Assets were non-
performing loans held-for-sale of $80 million and $69 million at
December 31, 2006 and 2005.
The Corporation has loan products with varying terms (e.g., interest-
only mortgages, option adjustable rate mortgages, etc.) and loans with
high loan-to-value ratios. Exposure to any of these loan products does not
result in a significant concentration of credit risk. Terms of loan products,
collateral coverage, the borrower’s credit history, and the amount of these
loans that are retained on our balance sheet are included in the Corpo-
ration’s assessment when establishing its Allowance for Loan and Lease
Losses.
Note 7 – Allowance for Credit Losses
The following table summarizes the changes in the allowance for credit losses for 2006, 2005 and 2004:
(Dollars in millions) 2006 2005 2004
Allowance for loan and lease losses, January 1
$ 8,045
$ 8,626 $ 6,163
FleetBoston balance, April 1, 2004
–
– 2,763
MBNA balance, January 1, 2006
577
––
Loans and leases charged off
(5,881)
(5,794) (4,092)
Recoveries of loans and leases previously charged off
1,342
1,232 979
Net charge-offs
(4,539)
(4,562) (3,113)
Provision for loan and lease losses
5,001
4,021 2,868
Other
(68)
(40) (55)
Allowance for loan and lease losses, December 31
9,016
8,045 8,626
Reserve for unfunded lending commitments, January 1
395
402 416
FleetBoston balance, April 1, 2004
–
–85
Provision for unfunded lending commitments
9
(7) (99)
Other
(7)
––
Reserve for unfunded lending commitments, December 31
397
395 402
Total allowance for credit losses
$ 9,413
$ 8,440 $ 9,028
118
Bank of America 2006