Bank of America 2006 Annual Report Download - page 53
Download and view the complete annual report
Please find page 53 of the 2006 Bank of America annual report below. You can navigate through the pages in the report by either clicking on the pages listed below, or by using the keyword search tool below to find specific information within the annual report.-
 1
1 -
2
-
3
-
4
-
5
-
6
-
7
-
8
-
9
-
10
-
11
-
12
-
13
-
14
-
15
-
16
-
17
-
18
-
19
-
20
-
21
-
22
-
23
-
24
-
25
-
26
-
27
-
28
-
29
-
30
-
31
-
32
-
33
-
34
-
35
-
36
-
37
-
38
-
39
-
40
-
41
-
42
-
 43
43 -
 44
44 -
 45
45 -
 46
46 -
 47
47 -
 48
48 -
 49
49 -
 50
50 -
 51
51 -
 52
52 -
 53
53 -
 54
54 -
 55
55 -
 56
56 -
 57
57 -
 58
58 -
 59
59 -
 60
60 -
 61
61 -
 62
62 -
 63
63 -
64
-
65
-
66
-
67
-
68
-
69
-
70
-
71
-
72
-
73
-
74
-
75
-
76
-
77
-
78
-
79
-
80
-
81
-
82
-
83
-
84
-
85
-
86
-
87
-
88
-
89
-
90
-
91
-
92
-
93
-
94
-
95
-
96
-
97
-
98
-
99
-
100
-
101
-
102
-
103
-
104
-
105
-
106
-
107
-
108
-
109
-
110
-
111
-
112
-
113
-
114
-
115
-
116
-
117
-
118
-
119
-
120
-
121
-
122
-
123
-
124
-
125
-
126
-
127
-
128
-
129
-
130
-
131
-
132
-
133
-
134
-
135
-
136
-
137
-
138
-
139
-
140
-
141
-
142
-
143
-
144
-
145
-
146
-
147
-
148
-
149
-
150
-
151
-
152
-
153
-
154
-
155
 |
 |

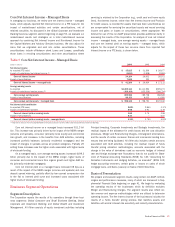
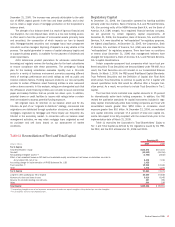
Balance Sheet
Average Balance
(Dollars in millions) 2006 2005
Total loans and leases
$243,282
$214,818
Total trading-related assets
338,364
314,568
Total market-based earning assets
(1)
369,164
322,236
Total earning assets
(2)
625,212
550,620
Total assets
(2)
706,906
633,253
Total deposits
205,652
189,860
Allocated equity
41,892
41,773
December 31
2006 2005
Total loans and leases
$246,490
$232,631
Total trading-related assets
309,321
291,267
Total market-based earning assets
(1)
347,572
305,374
Total earning assets
(2)
605,153
553,390
Total assets
(2)
689,248
633,362
Total deposits
216,875
198,352
Allocated equity
40,025
43,985
(1) Total market-based earning assets represents earning assets from the Capital Markets and Advisory
Services business.
(2) Total earning assets and Total Assets include asset allocations to match liabilities (i.e., deposits).
Global Corporate and Investment Banking provides a wide range of finan-
cial services to both our issuer and investor clients that range from busi-
ness banking clients to large international corporate and institutional
investor clients using a strategy to deliver value-added financial products
and advisory solutions. Global Corporate and Investment Banking’s prod-
ucts and services are delivered from three primary businesses: Business
Lending, Capital Markets and Advisory Services, and Treasury Services,
and are provided to our clients through a global team of client relationship
managers and product partners. In addition, ALM/Other includes the
results of ALM activities and our Latin America and Hong Kong based retail
and commercial banking businesses, parts of which were sold in 2006.
Our clients are supported through offices in 26 countries that are divided
into four distinct geographic regions: U.S. and Canada; Asia; Europe, Mid-
dle East, and Africa; and Latin America. For more information on our for-
eign operations, see Foreign Portfolio beginning on page 71.
Net Income increased $408 million, or six percent, in 2006. Driving
the increase were Trading Account Profits, Investment Banking Income,
and gains from the sale of our Brazilian operations and Asia Commercial
Banking business. These increases were partially offset by declines in Net
Interest Income and Gains on Sales of Debt Securities and increases in
Provision for Credit Losses and Noninterest Expense.
Although Global Corporate and Investment Banking experienced over-
all growth in Average Loans and Leases of $28.5 billion, or 13 percent,
and an increase in Average Deposits of $15.8 billion, or eight percent, Net
Interest Income declined primarily due to the impact of ALM activities,
spread compression in the loan portfolio and the impact of the sale of our
Brazilian operations in the third quarter of 2006. This decline was partially
offset by wider spreads in our Treasury Services deposit base as we effec-
tively managed pricing in a rising interest rate environment.
Noninterest Income increased $2.6 billion, or 27 percent, in 2006.
The increase in Noninterest Income was driven largely by the increase in
Trading Account Profits, Investment Banking Income, and the gain on the
sale of our Brazilian operations and Asia Commercial Banking business.
The increases in Trading Account Profits and Investment Banking Income
were driven by continued strength in debt underwriting, sales and trading,
and a favorable market environment. The sale of our Brazilian operations
and Asia Commercial Banking business generated $720 million and $165
million gains (pre-tax), respectively, and were reflected in all other income.
Provision for Credit Losses was negative $6 million in 2006 com-
pared to negative $291 million in 2005. The change in the Provision for
Credit Losses was primarily due to the absence in 2006 of benefits from
the release of reserves in 2005 related to an improved risk profile in Latin
America and reduced uncertainties associated with the FleetBoston Finan-
cial Corporation (FleetBoston) credit integration as well as lower commer-
cial recoveries in 2006. This increase was partially offset by benefits in
2006 from reductions in commercial reserves as a stable economic envi-
ronment throughout 2006 drove sustained favorable commercial credit
market conditions.
Noninterest Expense increased $865 million, or eight percent, mainly
due to higher Personnel expense, including performance-based incentive
compensation primarily in Capital Markets and Advisory Services and
Other General Operating costs.
Business Lending
Business Lending provides a wide range of lending-related products and
services to our clients through client relationship teams along with various
product partners. Products include commercial and corporate bank loans
and commitment facilities which cover our business banking clients, mid-
dle market commercial clients and our large multinational corporate cli-
ents. Real estate lending products are issued primarily to public and
private developers, homebuilders and commercial real estate firms. Leas-
ing and asset-based lending products offer our clients innovative financing
solutions. Products also include indirect consumer loans which allow us to
offer financing through automotive, marine, motorcycle and recreational
vehicle dealerships across the U.S. Business Lending also contains the
results for the economic hedging of our risk to certain credit counter-
parties utilizing various risk mitigation tools such as Credit Default Swaps
(CDS) and may also include the results of other products to help reduce
hedging costs.
Net Income decreased $365 million, or 14 percent, primarily due to
decreases in Net Interest Income and Noninterest Income, combined with
an increase in Noninterest Expense. These items were partially offset by a
decrease in the Provision for Credit Losses. The decrease in Net Interest
Income of $220 million or five percent, was driven by the impact of lower
spreads on all loan products which was partially offset by loan growth.
Average Loans and Leases increased 12 percent primarily due to growth in
the commercial and indirect consumer loan portfolio. The decrease in
Noninterest Income was due to an increase in credit mitigation costs as
spreads continued to tighten and lower equity gains in all other income.
Provision for Credit Losses was $3 million in 2006 compared to $67 mil-
lion in 2005. The low level of Provision for Credit Losses in 2006 was
driven by benefits in 2006 from reductions in commercial reserves as a
stable economic environment throughout 2006 drove sustained favorable
commercial credit market conditions. These benefits were in part offset by
lower commercial recoveries in 2006. Benefits from the release of
reserves related to reduced uncertainties associated with the FleetBoston
credit integration contributed to the low level of Provision for Credit Losses
in 2005. The increase in Noninterest Expense was primarily driven by
increased expenses associated with Personnel, technology, and Pro-
fessional Fees.
Capital Markets and Advisory Services
Capital Markets and Advisory Services provides products, advisory serv-
ices and financing globally to our institutional investor clients in support of
their investing and trading activities. We also work with our commercial
and corporate issuer clients to provide debt and equity underwriting and
distribution capabilities, merger-related advisory services and risk
management solutions using interest rate, equity, credit and commodity
derivatives, foreign exchange, fixed income and mortgage-related products.
Bank of America 2006
51