Bank of America 2006 Annual Report Download - page 58
Download and view the complete annual report
Please find page 58 of the 2006 Bank of America annual report below. You can navigate through the pages in the report by either clicking on the pages listed below, or by using the keyword search tool below to find specific information within the annual report.-
 1
1 -
2
-
3
-
4
-
5
-
6
-
7
-
8
-
9
-
10
-
11
-
12
-
13
-
14
-
15
-
16
-
17
-
18
-
19
-
20
-
21
-
22
-
23
-
24
-
25
-
26
-
27
-
28
-
29
-
30
-
31
-
32
-
33
-
34
-
35
-
36
-
37
-
38
-
39
-
40
-
41
-
42
-
43
-
44
-
45
-
46
-
47
-
 48
48 -
 49
49 -
 50
50 -
 51
51 -
 52
52 -
 53
53 -
 54
54 -
 55
55 -
 56
56 -
 57
57 -
 58
58 -
 59
59 -
 60
60 -
 61
61 -
 62
62 -
 63
63 -
 64
64 -
 65
65 -
 66
66 -
 67
67 -
 68
68 -
69
-
70
-
71
-
72
-
73
-
74
-
75
-
76
-
77
-
78
-
79
-
80
-
81
-
82
-
83
-
84
-
85
-
86
-
87
-
88
-
89
-
90
-
91
-
92
-
93
-
94
-
95
-
96
-
97
-
98
-
99
-
100
-
101
-
102
-
103
-
104
-
105
-
106
-
107
-
108
-
109
-
110
-
111
-
112
-
113
-
114
-
115
-
116
-
117
-
118
-
119
-
120
-
121
-
122
-
123
-
124
-
125
-
126
-
127
-
128
-
129
-
130
-
131
-
132
-
133
-
134
-
135
-
136
-
137
-
138
-
139
-
140
-
141
-
142
-
143
-
144
-
145
-
146
-
147
-
148
-
149
-
150
-
151
-
152
-
153
-
154
-
155
 |
 |
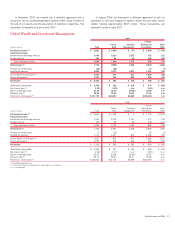
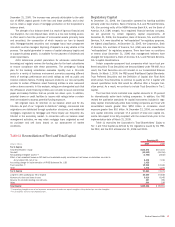
Restructuring Charges, intersegment eliminations, and the results of cer-
tain consumer finance and commercial lending businesses that are being
liquidated. Other also includes certain amounts associated with ALM activ-
ities, including the residual impact of funds transfer pricing allocation
methodologies, amounts associated with the change in the value of
derivatives used as economic hedges of interest rate and foreign
exchange rate fluctuations that do not qualify for SFAS 133 hedge account-
ing treatment, certain gains or losses on sales of whole mortgage loans,
and Gains (Losses) on Sales of Debt Securities. The objective of the funds
transfer pricing allocation methodology is to neutralize the businesses
from changes in interest rate and foreign exchange fluctuations. Accord-
ingly, for segment reporting purposes, the businesses received in 2005
the neutralizing benefit to Net Interest Income related to certain of the
economic hedges previously mentioned, with the offset recorded in Other.
Other also includes adjustments in Noninterest Income and Income Tax
Expense to remove the FTE impact of items (primarily low-income housing
tax credits) that have been grossed up within Noninterest Income to a fully
taxable equivalent amount in the other segments.
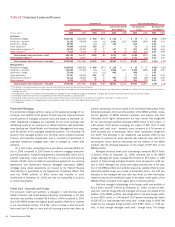
Net Income increased $23 million, or three percent, primarily due to
increases in Equity Investment Gains, Net Interest Income, decreases in
Provision for Credit Losses, and all other noninterest expense. These
changes were largely offset by a decrease in Gains (Losses) on Sales of
Debt Securities and an increase in Merger and Restructuring Charges. The
increase in Net Interest Income of $446 million is due primarily to the
$419 million negative impact to 2005 results retained in All Other relating
to funds transfer pricing that was not allocated to the businesses. Equity
Investment Gains increased $902 million due to favorable market con-
ditions driving liquidity in the Principal Investing portfolio as well as a $341
million gain recorded on the liquidation of a strategic European
investment.
Provision for Credit Losses decreased $185 million to a negative
$116 million. In 2005 a $50 million reserve for estimated losses asso-
ciated with Hurricane Katrina was established. We did not incur significant
losses from Hurricane Katrina and, therefore, released the previously
established reserve in 2006.
The decrease in Gains (Losses) on Sales of Debt Securities of $1.3
billion resulted from a loss on the sale of mortgage-backed securities,
which was driven by a decision to hold a lower level of investments in
securities relative to loans (see “Interest Rate Risk Management – Secu-
rities” on page 78 for further discussion), compared with gains recorded
on the sales of mortgage-backed securities in 2005.
Merger and Restructuring Charges were $805 million in 2006 com-
pared to $412 million in 2005. The charge in 2006 was due to the MBNA
merger whereas the 2005 charge was primarily related to the FleetBoston
merger. See Note 2 of the Consolidated Financial Statements for further
information associated with the MBNA merger. The decline in all other
noninterest expense of $343 million is due to decreases in unallocated
residual general operating expenses.
Income Tax Expense (Benefit) was $176 million in 2006 compared to
$(20) million in 2005. This change was driven by both a $175 million
cumulative tax charge in 2006 resulting from the change in tax legislation
relating to the extraterritorial income and foreign sales corporation
regimes and by higher pre-tax income.
Off- and On-Balance Sheet Financing Entities
Off-Balance Sheet Commercial Paper Conduits
In addition to traditional lending, we also support our customers’ financing
needs by facilitating their access to the commercial paper markets. These
markets provide an attractive, lower-cost financing alternative for our cus-
tomers. Our customers sell or otherwise transfer assets, such as high-
grade trade or other receivables or leases, to a commercial paper
financing entity, which in turn issues high-grade short-term commercial
paper that is collateralized by the underlying assets. We facilitate these
transactions and collect fees from the financing entity for the services it
provides including administration, trust services and marketing the com-
mercial paper.
We receive fees for providing combinations of liquidity and standby
letters of credit (SBLCs) or similar loss protection commitments to the
commercial paper financing entities. These forms of asset support are
senior to the first layer of asset support provided by customers through
over-collateralization or by support provided by third parties. The rating
agencies require that a certain percentage of the commercial paper enti-
ty’s assets be supported by the seller’s over-collateralization and our
SBLC in order to receive their respective investment rating. The SBLC
would be drawn on only when the over-collateralization provided by the
seller is not sufficient to cover losses of the related asset. Liquidity com-
mitments made to the commercial paper entity are designed to fund
scheduled redemptions of commercial paper if there is a market disruption
or the new commercial paper cannot be issued to fund the redemption of
the maturing commercial paper. The liquidity facility has the same legal
priority as the commercial paper. We do not enter into any other form of
guarantee with these entities.
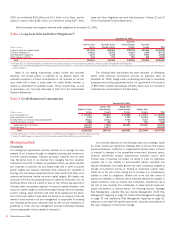
We manage our credit risk on these commitments by subjecting them
to our normal underwriting and risk management processes. At
December 31, 2006 and 2005, we had off-balance sheet liquidity
commitments and SBLCs to these entities of $36.7 billion and $25.9 bil-
lion. Substantially all of these liquidity commitments and SBLCs mature
within one year. These amounts are included in Table 9. Net revenues
earned from fees associated with these off-balance sheet financing enti-
ties were $91 million and $72 million in 2006 and 2005.
From time to time, we may purchase some of the commercial paper
issued by certain of these entities for our own account or acting as a
dealer on behalf of third parties. SBLCs are initially recorded at fair value
in accordance with Financial Accounting Standards Board (FASB) Inter-
pretation No. 45, “Guarantor’s Accounting and Disclosure Requirements
for Guarantees” (FIN 45). Liquidity commitments and SBLCs subsequent
to inception are accounted for pursuant to SFAS No. 5, “Accounting for
Contingencies” (SFAS 5), and are discussed further in Note 13 of the
Consolidated Financial Statements.
The commercial paper conduits are variable interest entities (VIEs) as
defined in FASB Interpretation No. 46 (Revised December 2003),
“Consolidation of Variable Interest Entities, an interpretation of ARB
No. 51” (FIN 46R), which provides a framework for identifying VIEs and
determining when a company should include the assets, liabilities,
non-controlling interests and results of activities of a VIE in its con-
solidated financial statements. In accordance with FIN 46R, the primary
beneficiary is the party that consolidates a VIE based on its assessment
that it will absorb a majority of the expected losses or expected residual
returns of the entity, or both. We have determined that we are not the
primary beneficiary of the commercial paper conduits described above
and, therefore, have not included the assets and liabilities or results of
operations of these conduits in the Consolidated Financial Statements of
the Corporation.
On-Balance Sheet Commercial Paper Conduits
In addition to the off-balance sheet financing entities previously described,
we also utilize commercial paper conduits that have been consolidated
56
Bank of America 2006