Bank of America 2006 Annual Report Download - page 78
Download and view the complete annual report
Please find page 78 of the 2006 Bank of America annual report below. You can navigate through the pages in the report by either clicking on the pages listed below, or by using the keyword search tool below to find specific information within the annual report.-
 1
1 -
2
-
3
-
4
-
5
-
6
-
7
-
8
-
9
-
10
-
11
-
12
-
13
-
14
-
15
-
16
-
17
-
18
-
19
-
20
-
21
-
22
-
23
-
24
-
25
-
26
-
27
-
28
-
29
-
30
-
31
-
32
-
33
-
34
-
35
-
36
-
37
-
38
-
39
-
40
-
41
-
42
-
43
-
44
-
45
-
46
-
47
-
48
-
49
-
50
-
51
-
52
-
53
-
54
-
55
-
56
-
57
-
58
-
59
-
60
-
61
-
62
-
63
-
64
-
65
-
66
-
67
-
 68
68 -
 69
69 -
 70
70 -
 71
71 -
 72
72 -
 73
73 -
 74
74 -
 75
75 -
 76
76 -
 77
77 -
 78
78 -
 79
79 -
 80
80 -
 81
81 -
 82
82 -
 83
83 -
 84
84 -
 85
85 -
 86
86 -
 87
87 -
 88
88 -
89
-
90
-
91
-
92
-
93
-
94
-
95
-
96
-
97
-
98
-
99
-
100
-
101
-
102
-
103
-
104
-
105
-
106
-
107
-
108
-
109
-
110
-
111
-
112
-
113
-
114
-
115
-
116
-
117
-
118
-
119
-
120
-
121
-
122
-
123
-
124
-
125
-
126
-
127
-
128
-
129
-
130
-
131
-
132
-
133
-
134
-
135
-
136
-
137
-
138
-
139
-
140
-
141
-
142
-
143
-
144
-
145
-
146
-
147
-
148
-
149
-
150
-
151
-
152
-
153
-
154
-
155
 |
 |

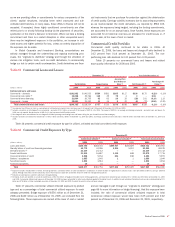
Equity Market Risk
Equity market risk represents exposures to securities that represent an
ownership interest in a corporation in the form of domestic and foreign
common stock or other equity-linked instruments. Instruments that would
lead to this exposure include, but are not limited to, the following: com-
mon stock, exchange traded funds, American Depositary Receipts (ADRs),
convertible bonds, listed equity options (puts and calls), over-the-counter
equity options, equity total return swaps, equity index futures and other
equity derivative products. Hedging instruments used to mitigate this risk
include options, futures, swaps, convertible bonds and cash positions.
Commodity Risk
Commodity risk represents exposures to instruments traded in the petro-
leum, natural gas, power, and metals markets. These instruments consist
primarily of futures, forwards, swaps and options. Hedging instruments
used to mitigate this risk include options, futures and swaps in the same
or similar commodity product, as well as cash positions.
Issuer Credit Risk
Issuer credit risk represents exposures to changes in the creditworthiness
of individual issuers or groups of issuers. Our portfolio is exposed to
issuer credit risk where the value of an asset may be adversely impacted
by changes in the levels of credit spreads, by credit migration, or by
defaults. Hedging instruments used to mitigate this risk include bonds,
credit default swaps and other credit fixed income instruments.
Trading Risk Management
Trading-related revenues represent the amount earned from trading posi-
tions which are taken in a diverse range of financial instruments and
markets. Trading account assets and liabilities and derivative positions
are reported at fair value. For more information on fair value, see Complex
Accounting Estimates beginning on page 81. Trading Account Profits
represent the net amount earned from our trading positions and, as
reported in the Consolidated Statement of Income, do not include the Net
Interest Income recognized on trading positions, or the related funding
charge or benefit. Trading Account Profits can be volatile and are largely
driven by general market conditions and customer demand. Trading
Account Profits are dependent on the volume and type of transactions, the
level of risk assumed, and the volatility of price and rate movements at
any given time within the ever-changing market environment.
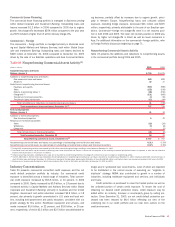
The histogram of daily revenue or loss below is a graphic depiction of
trading volatility and illustrates the daily level of trading-related revenue for
2006. Trading-related revenue encompasses proprietary trading and
customer-related activities. During 2006, positive trading-related revenue
was recorded for 96 percent of the trading days. Furthermore, there were
no trading days with losses greater than $10 million and the largest loss
was $10 million. This can be compared to 2005, where positive trading-
related revenue was recorded for 86 percent of the trading days and only
four percent of the total trading days had losses greater than $10 million
and the largest loss was $55 million.
To evaluate risk in our trading activities, we focus on the actual and
potential volatility of individual positions as well as portfolios. At a portfolio
and corporate level, we use VAR modeling and stress testing. VAR is a key
statistic used to measure market risk. In order to manage day-to-day risks,
VAR is subject to trading limits both for our overall trading portfolio and
within individual businesses. Senior management reviews and evaluates
the results of these limit excesses.
A VAR model simulates the value of a portfolio under a range of hypo-
thetical scenarios in order to generate a distribution of potential gains and
losses. The VAR represents the worst loss the portfolio is expected to
experience with a given level of confidence. VAR depends on the volatility
of the positions in the portfolio and on how strongly their risks are corre-
lated. Within any VAR model, there are significant and numerous assump-
tions that will differ from company to company. Our VAR model uses a
historical simulation approach based on three years of historical data and
assumes a 99 percent confidence level. Statistically, this means that
losses will exceed VAR, on average, one out of 100 trading days, or two to
three times each year. Actual losses did not exceed VAR in 2006 and
exceeded VAR twice in 2005.
The assumptions and data underlying our VAR model are updated on
a regular basis. In addition, the predictive accuracy of the model is
periodically tested by comparing actual losses for individual businesses
with the losses predicted by the VAR model. Senior management reviews
and evaluates the results of these tests.
Histogram of Daily Trading-related Revenue
Twelve Months Ended December 31, 2006
0
10
20
30
40
50
60
70
80
90
< -50 -50 to -40 -40 to -30 -30 to -20 -20 to -10 -10 to 0 0 to 10 10 to 20 20 to 30 30 to 40 40 to 50 > 50
Revenue (dollars in millions)
Number of Days
76
Bank of America 2006