Bank of America 2006 Annual Report Download - page 39
Download and view the complete annual report
Please find page 39 of the 2006 Bank of America annual report below. You can navigate through the pages in the report by either clicking on the pages listed below, or by using the keyword search tool below to find specific information within the annual report.-
 1
1 -
2
-
3
-
4
-
5
-
6
-
7
-
8
-
9
-
10
-
11
-
12
-
13
-
14
-
15
-
16
-
17
-
18
-
19
-
20
-
21
-
22
-
23
-
24
-
25
-
26
-
27
-
28
-
 29
29 -
 30
30 -
 31
31 -
 32
32 -
 33
33 -
 34
34 -
 35
35 -
 36
36 -
 37
37 -
 38
38 -
 39
39 -
 40
40 -
 41
41 -
 42
42 -
 43
43 -
 44
44 -
 45
45 -
 46
46 -
 47
47 -
 48
48 -
 49
49 -
50
-
51
-
52
-
53
-
54
-
55
-
56
-
57
-
58
-
59
-
60
-
61
-
62
-
63
-
64
-
65
-
66
-
67
-
68
-
69
-
70
-
71
-
72
-
73
-
74
-
75
-
76
-
77
-
78
-
79
-
80
-
81
-
82
-
83
-
84
-
85
-
86
-
87
-
88
-
89
-
90
-
91
-
92
-
93
-
94
-
95
-
96
-
97
-
98
-
99
-
100
-
101
-
102
-
103
-
104
-
105
-
106
-
107
-
108
-
109
-
110
-
111
-
112
-
113
-
114
-
115
-
116
-
117
-
118
-
119
-
120
-
121
-
122
-
123
-
124
-
125
-
126
-
127
-
128
-
129
-
130
-
131
-
132
-
133
-
134
-
135
-
136
-
137
-
138
-
139
-
140
-
141
-
142
-
143
-
144
-
145
-
146
-
147
-
148
-
149
-
150
-
151
-
152
-
153
-
154
-
155
 |
 |

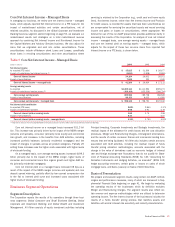
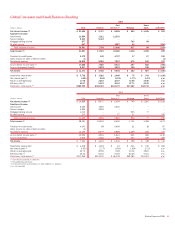
Global Corporate and Investment Banking
Net Income increased $408 million, or six percent, to $6.8 billion in 2006
compared to 2005. Total Revenue increased $2.1 billion, or 10 percent,
to $22.7 billion in 2006 compared to 2005, driven primarily by higher
Trading Account Profits and Investment Banking Income, and gains on the
sales of our Brazilian operations and Asia Commercial Banking business.
Offsetting these increases was spread compression in the loan portfolios
which adversely impacted Net Interest Income. In addition, Net Income in
2006 was impacted by increases in Noninterest Expense and Provision for
Credit Losses, and a decrease in Gains on Sales of Debt Securities. For
more information on Global Corporate and Investment Banking, see
page 50.
Global Wealth and Investment Management
Net Income increased $87 million, or four percent, to $2.4 billion in 2006
compared to 2005. The increase was due to higher Total Revenue of
$463 million, or six percent, primarily as a result of an increase in Invest-
ment and Brokerage Services partially offset by an increase in Noninterest
Expense of $295 million, or eight percent, driven by higher personnel-
related costs.
Total assets under management increased $60.6 billion to $542.9
billion at December 31, 2006 compared to December 31, 2005. For more
information on Global Wealth and Investment Management, see page 53.
All Other
Net Income increased $23 million to $767 million in 2006 compared to
2005. This increase was primarily a result of higher Equity Investment
Gains of $902 million and Net Interest Income of $446 million offset by
lower Gains (Losses) on Sales of Debt Securities of $(495) million in
2006 compared to $823 million in 2005. For more information on All
Other, see page 55.
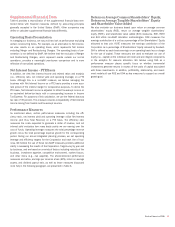
Financial Highlights
Net Interest Income
Net Interest Income on a FTE basis increased $4.2 billion to $35.8 billion
in 2006 compared to 2005. The primary drivers of the increase were the
impact of the MBNA merger (volumes and spreads), consumer and com-
mercial loan growth, and increases in the benefits from asset and liability
management (ALM) activities including higher portfolio balances (primarily
residential mortgages) and the impact of changes in spreads across all
product categories. These increases were partially offset by a lower con-
tribution from market-based earning assets and the higher costs asso-
ciated with higher levels of wholesale funding. The net interest yield on a
FTE basis decreased two basis points (bps) to 2.82 percent in 2006 due
primarily to an increase in lower yielding market-based earning assets and
loan spreads that continued to tighten due to the flat to inverted yield
curve. These decreases were partially offset by widening of spreads on
core deposits. For more information on Net Interest Income on a FTE
basis, see Tables I and II beginning on page 86.
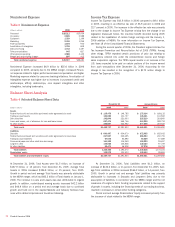
Noninterest Income
Table 2 Noninterest Income
(Dollars in millions) 2006 2005
Card income
$14,293
$ 5,753
Service charges
8,224
7,704
Investment and brokerage services
4,456
4,184
Investment banking income
2,317
1,856
Equity investment gains
3,189
2,212
Trading account profits
3,166
1,763
Mortgage banking income
541
805
Other income
2,246
1,077
Total noninterest income
$38,432
$25,354
Noninterest Income increased $13.1 billion to $38.4 billion in 2006
compared to 2005, due primarily to the following:
ŠCard Income increased $8.5 billion primarily due to the addition of
MBNA resulting in higher excess servicing income, cash advance fees,
interchange income and late fees.
ŠService Charges grew $520 million due to increased non-sufficient
funds fees and overdraft charges, account service charges, and ATM
fees resulting from new account growth and increased account usage.
ŠInvestment and Brokerage Services increased $272 million primarily
reflecting higher levels of assets under management.
ŠInvestment Banking Income increased $461 million due to higher mar-
ket activity and continued strength in debt underwriting.
ŠEquity Investment Gains increased $977 million primarily due to favor-
able market conditions driven by liquidity in the capital markets as well
as a $341 million gain recorded on the liquidation of a strategic Euro-
pean investment.
ŠTrading Account Profits increased $1.4 billion due to a favorable market
environment, and benefits from previous investments in personnel and
trading infrastructure.
ŠMortgage Banking Income decreased $264 million primarily due to
weaker production income driven by margin compression, which neg-
atively impacted the pricing of loans, and a decision to retain a larger
portion of mortgage production.
ŠOther Income increased $1.2 billion primarily related to the $720 mil-
lion (pre-tax) gain on the sale of our Brazilian operations and the $165
million (pre-tax) gain on the sale of our Asia Commercial Banking busi-
ness.
Provision for Credit Losses
The Provision for Credit Losses increased $996 million to $5.0 billion in
2006 compared to 2005. Provision expense rose due to increases from
the addition of MBNA, reduced benefits from releases of commercial
reserves and lower commercial recoveries. These increases were partially
offset by lower bankruptcy-related credit costs on the domestic consumer
credit card portfolio.
For more information on credit quality, see Credit Risk Management
beginning on page 62.
Gains (Losses) on Sales of Debt Securities
Gains (Losses) on Sales of Debt Securities were $(443) million in 2006
compared to $1.1 billion in 2005. The decrease was primarily due to a
loss on the sale of mortgage-backed securities in 2006 compared to gains
recorded in 2005. For more information on Gains (Losses) on Sales of
Debt Securities, see “Interest Rate Risk Management – Securities” begin-
ning on page 78.
Bank of America 2006
37